This turned out much longer than I planned so I hope it is useful and can be a resource for others with the same questions.
I believe you mean to ask primarily about the discrete Fourier transform (in which case your definition (2) for $\hat{f}_\alpha$ is not right, for the DFT it should be $\hat{f}_\alpha = \sum_{j=0}^{2M-1} x_j \exp(- i\alpha\frac{\pi j}{M})$) so I will concentrate on that. I think it is instructive to consider this graphically. I'll try to break things down into a few steps and you should feel free to ask for clarification.
Phasors
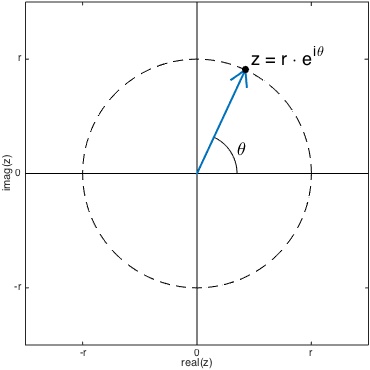
A complex number, $z = r \cdot \operatorname{e}^{i\theta}$, can be drawn in the complex plane as follows:

This type of plot is sometimes called a phasor diagram and is commonly used by electrical engineers and others who deal with complex valued signal processing applications. It can be a very useful way to visualize complex signals.
Phasor diagrams of complex exponentials
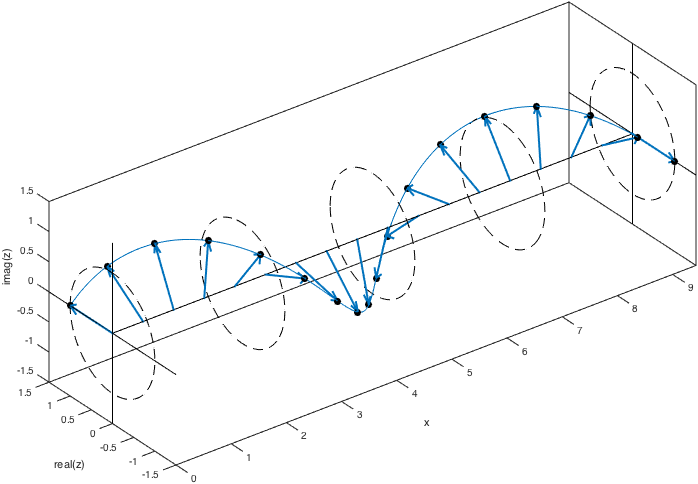
Using phasors, the function $z_1 = \operatorname{e}^{ix}$ can be plotted on three dimensional axes as

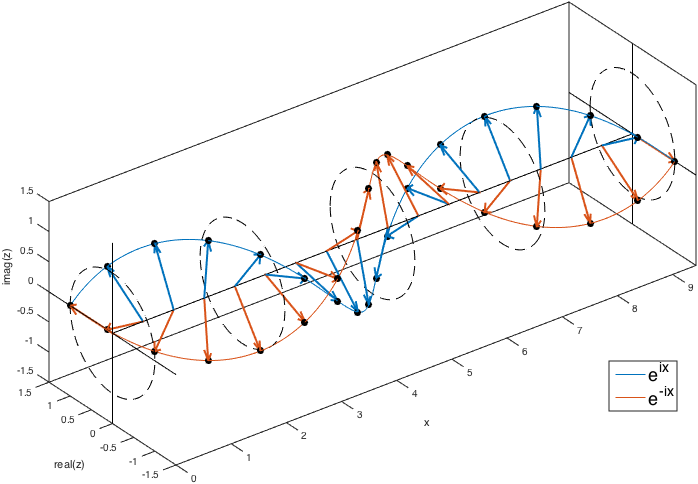
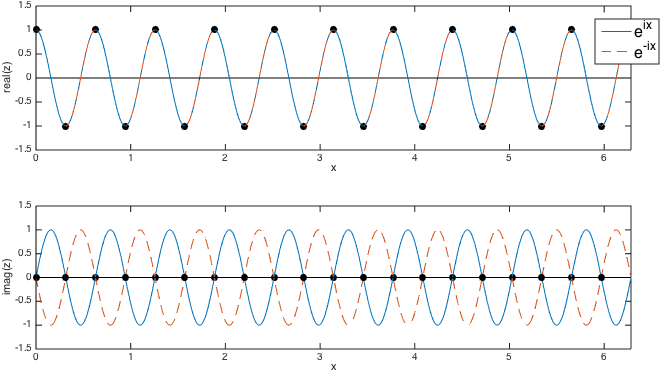
Now, what happens if we plot at $z_2 = \operatorname{e}^{-ix}$? The spiral rotates in the opposite direction, but with the same frequency! This causes the real parts of $z_1$ and $z_2$ to remain in phase while the imaginary parts are 180 degrees out of phase. This is why there is a distinction between positive and negative frequencies. Unfortunately this is a bit hard to see with a 3D plot displayed on a 2D screen so I'll also plot the real and imaginary parts of these functions.


A couple things to note:
- Real valued functions have Fourier coefficients which satisfy $\hat{f}_{\alpha} = \operatorname{conj}\left(\hat{f}_{-\alpha}\right)$, this must be the case so that the imaginary parts sum to zero.
- The complex exponentials are periodic and intersect at regular intervals.
Uniqueness of Fourier coefficients
Since the complex exponentials intersect at regular intervals, one must take care when representing them on a grid. Making things more confusing, the example you have picked out highlights a somewhat special case, the Nyquist frequency. Let's take $M=10$ and plot the complex exponentials $z_1 = e^{iMx}$ and $z_2 = e^{-iMx}$ and also mark the grid points $x_j = \frac{\pi j}{M}$ for $j\in\{0..19\}$. Just as you noted, both functions are equal to $(-1)^j$ on this grid.

As you can see, these two functions are identical on the grid despite having different imaginary parts between grid points. If the only points you sample are on this grid, these functions cannot be distinguished. In fact, the Nyquist-Shannon Sampling Theorem states that it is sufficient to sample at a rate at least twice the highest frequency present in a signal. Under some additional restrictions (uniform sampling, Fourier reconstruction) this condition is also necessary. This means that since we have taken $2M$ samples, we should not be able to reconstruct (or uniquely determine) any signal components with wavelengths shorter than $2\pi/M$.
The frequency you have chosen to ask about has wavelength exactly equal to $2\pi/M$ and is called the Nyquist frequency. This is right on the boundary of meeting the Nyquist-Shannon sampling criteria and leads to much confusion. Notice that we have chosen $M=10$, which leads to 20 sampling points (the point at $x=2\pi$ is the same as $x=0$ due to periodicity and is therefore not included) and thus we expect 20 Fourier coefficients (including zero). Whether we have $\alpha \in\{-10..9\}$ or $\alpha \in\{-9..10\}$ or some combination of $\alpha=-10$ and $\alpha=10$ is ambiguous. For even numbers of sample points this is always the case, we can tell that the $M$ frequency component is present, but we cannot tell if it is positive or negative or some combination of the two. For odd numbers of sample points this ambiguity does not exist, adding another sample point would push us past the sampling limit and give us $\alpha \in\{-10..10\}$ and the ability to distinguish these two frequency components.
Can you discern $\hat{f}_{\alpha}$ from $\hat{f}_{\alpha + 2M}$?
This question again comes back to the Shannon Sampling Theorem. $\alpha + 2M$ (for $\alpha<M$) is always greater than your sampling rate and therefore exceeds tthe frequency you can distinguish at that sampling rate. Furthermore, the algebra works out that
\begin{align}
\exp\left(i~(\alpha+2M)\dfrac{j\pi}{M}\right)
& = \exp\left(i~\alpha\dfrac{j\pi}{M}\right)\exp\left(i~2M\dfrac{j\pi}{M}\right)\\
& = \exp\left(i~\alpha\dfrac{j\pi}{M}\right)\exp\left(i~2\pi j\right)\\
& = \exp\left(i~\alpha\dfrac{j\pi}{M}\right)\exp\left(i~0\right)\\
& = \exp\left(i~\alpha\dfrac{j\pi}{M}\right)
\end{align}
so the two functions are always equal on your sampling grid.
Complex versus real discrete Fourier transforms
You are correct that weights for the positive and negative frequency components are complex conjugates in the case of real-valued functions. As I mentioned, this must be the case so that the imaginary parts cancel out and give you a real-valued function. There are two ways to think of this:
You have only half as much information in the function values since there is no imaginary part ($2M$ "pieces" of real-valued information), and that leads to half as much information in the Fourier coefficients ($M$ complex values that each hold a real and imaginary part for $2M$ pieces of information). If you know the positive frequency coefficients you know the negative frequency coefficients are just their conjugates (or vice versa).
You have the same amount of information in the function values since knowing that they are all real is information. Knowing that the $2M$ imaginary parts are zero is just as much information as knowing that they had some other value. If even one value was complex it would change all your frequency coefficients. That leads to the same amount of information in the frequency components since knowing that the are all conjugates is information (2 pieces for each: real parts equal and imaginary parts opposite).
Both of these views are equivalent and lead to the same conclusions. Personally, I prefer to think of real-valued samples as $2M$ pieces of information which leads to $M$ complex-valued coefficients, each consisting of a magnitude and phase, giving the same amount of information.


