3
$\begingroup$

My goal is to create a numerical solution of 1D-solute transport (Convective-dispersion equation, CDE) to match it's analytical solution based on experimental data. The CDE can be written as (where, C= solute concentration, D= dispersion coefficient, v=velocity, t=time):

$$-v\frac{\partial C}{\partial x} + D\frac{\partial^ 2C}{\partial^ 2x} = \frac{\partial C}{\partial t} $$

The fully explicit finite-difference approximation for the CDE is:

$$C_{x,t} = C_{x,t-\Delta t} + \frac{D \Delta t}{\Delta x^2}(C|_{x+\Delta x, t-\Delta t}- 2C|_{x,t-\Delta t} + C|_{x-\Delta x,t-\Delta t}) - \frac{v\Delta t}{2 \Delta x}(C|_{x+\Delta x,t-\Delta t} - C|_{x-\Delta x, t-\Delta t}) $$

when, the initial condition: $$C(x,0) = 0$$ Left boundary condition: $$C(0,t) = C_{0}$$ Right boundary condition at infinite distance: $$\frac{\partial C}{\partial x} (\infty, t) = 0$$

the analytical solution can be given by: $$\frac{C}{C_{0}} = \frac{1}{2}\operatorname{erfc}\Bigg[\frac{Rx-vt}{2(DRt)^\frac{1}{2}}\Bigg]+ \frac{1}{2}\exp\Bigg(\frac{vx}{D}\Bigg)\operatorname{erfc}\Bigg[\frac{Rx+vt}{2(DRt)^\frac{1}{2}}\Bigg]$$

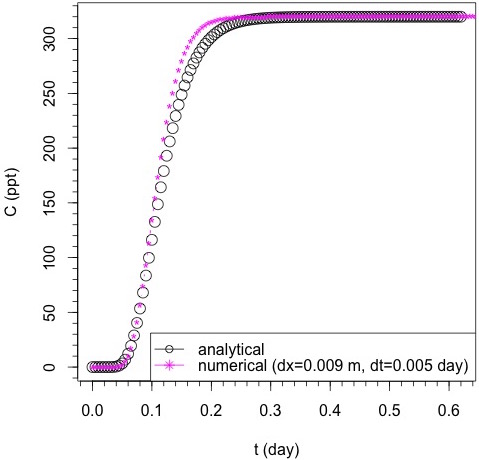
For the analytical expression, breakthrough $(C=C_{0})$ occurs at a distance of $x=0.075$ $m$ at $0.61$ $days$ (see black line in the attcahed figure) given a $D = 0.0033$ $m^2/day$, $v =0.66$ $m/day$, a retardation, $R = 1$ (dimensionless), and a constant input concentration $C_{0} = 320$ $ppt$. The numerical solution plotted for the same distance, $x$, was simulated with the same $D$ and $v$ values with a $\Delta t = 0.005$ $days$ and $\Delta x = 0.009375$ $m$ (magenta). The parameters used for numerical solution were well within the prescribed stability limits: $\frac{v\Delta t}{2D}=0.00001 <<1$; $\frac{D\Delta t}{\Delta x^2}=0.19 <0.5$; $P_{e}=$$\frac{v\Delta x}{2D}=0.94 <=1$; and $1-\Delta t\Big(\frac{2D}{\Delta x^2}+\frac{v}{2\Delta x}\Big)=0.45>=0$ along with a Reynold's number, $R_{L}=15$. The numerical solution was set up in an excel spreadsheet with the same boundary conditions described above. Since it is not possible to set up the right boundary at "$\infty$" distance, I set it up at an arbitrary distance of $x=1.74 $ $m$, but extending this distance futhur doesn't change the outcome (e.g. early breakthrough) in any significant way.

enter image description here

My question is: is the numerical approximation good enough? Is there a better way of implementing it especially when retardation and reaction terms needs to be incorporated?
$\endgroup$
1
  • $\begingroup$ Note that the name of the equation is convection-diffusion equation (not convection-dispersion.) $\endgroup$
    – timur
    Commented Mar 16 at 3:57

3 Answers 3

1
$\begingroup$

I solved this equation using Octave and the pde1d function. pde1d uses a two-node, linear finite element for spatial discretization and solution of the time-dependent ODE is by the implicit BDF solver, IDA, from Sundials.

I believe that the spatial discretization is basically equivalent to the FD approach in the post. Solution of the system of ODE using IDA is done to a relatively high accuracy, however.

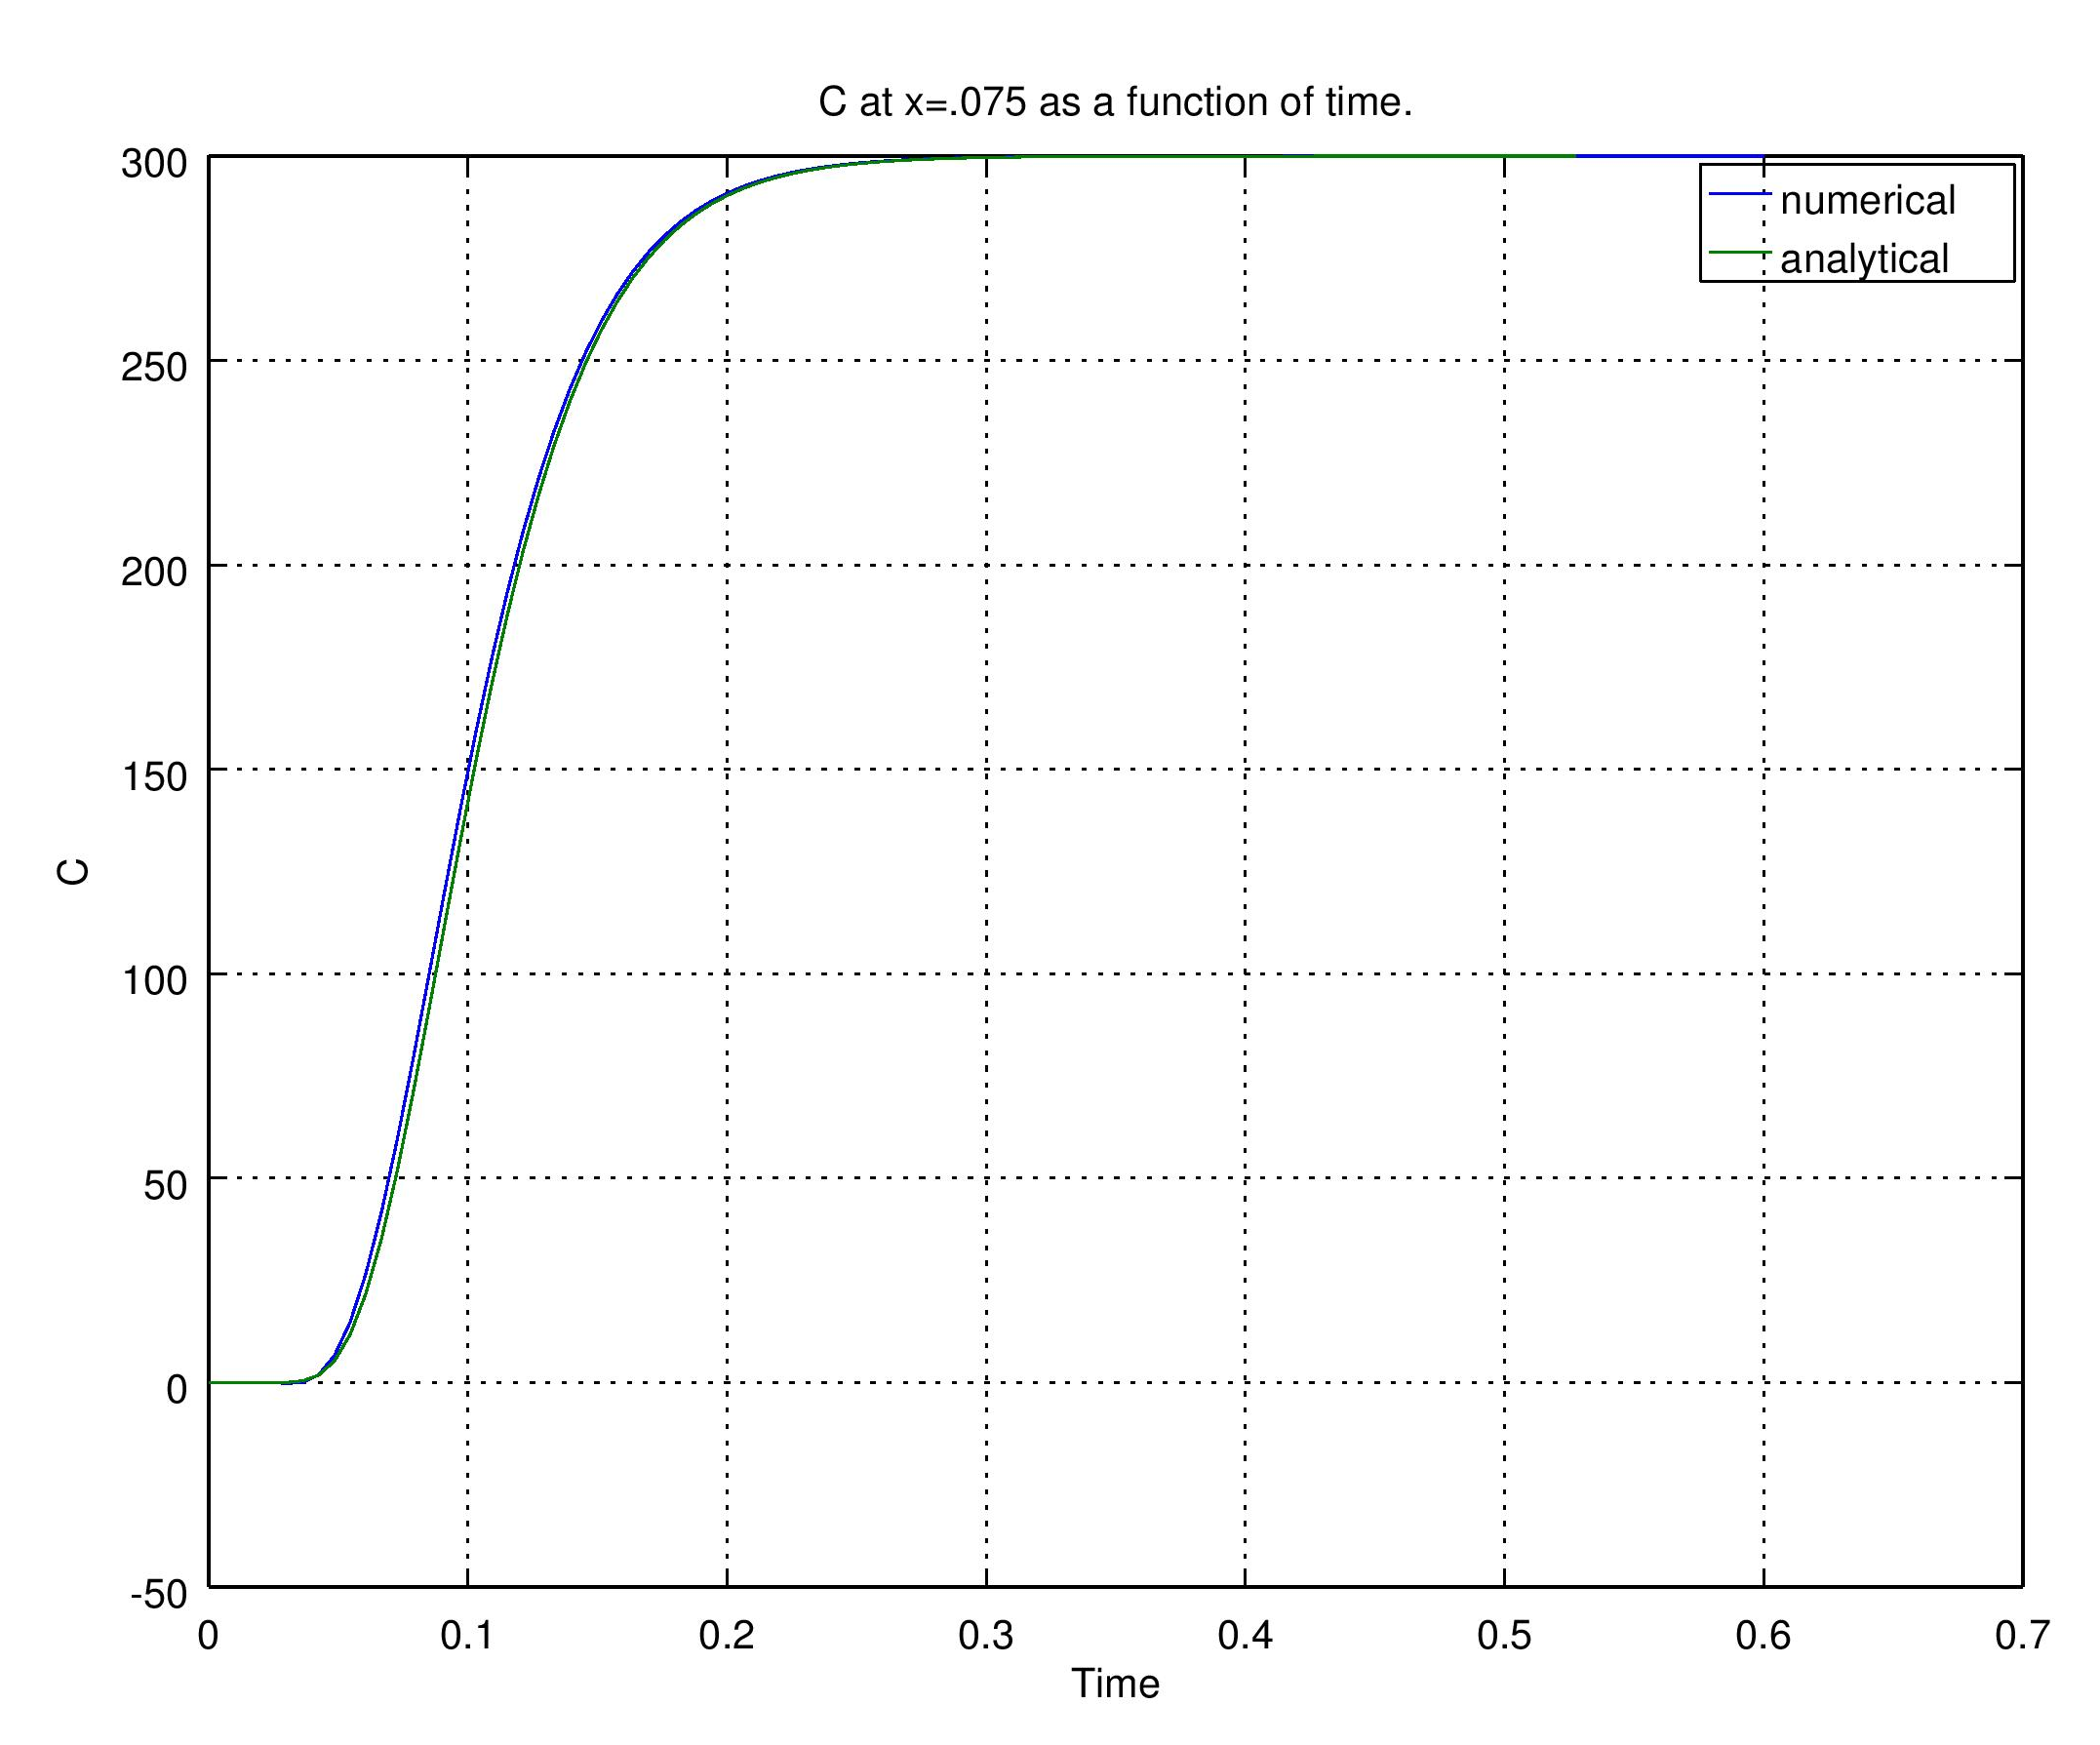
Using a mesh with 300 points ($\Delta x = .009m$) the agreement between the numerical and analytical solutions is relatively good as seen in the figure below. The Octave script is also shown below. enter image description here

When the mesh is refined to 500 points the numerical and analytical solutions are almost indistinguishable on a plot.

pde1d is similar to the MATLAB function pdepe so I expect that pdepe would produce similar results using the script shown below.

function cse_11_06_16
n=300;
L=2.7;
x = linspace(0,L,n);
fprintf('dx=%6.3f\n', L/n);
[dum,nb] = min(abs(x-.075));
tFinal = .6;
nt = 100;
t = linspace(0,tFinal,nt);
C0=300;
D=.0033;
v=.66;
cAnal=uAnal(x,t,D, v, C0);
if(0)
figure; plot(t, cAnal(:,nb), 'o'); grid on;
return;
end

pdeFunc = @(x,t,u,DuDx) pde(x,t,u,DuDx, D, v);
icFunc = @(x) ic(x, C0);
bcFunc = @(xl,ul,xr,ur,t) bc(xl,ul,xr,ur,t, C0);

m=0;
opts.abstol=1e-8;
opts.vectorized='on';
tic
u = pde1d(m, pdeFunc,icFunc,bcFunc,x,t,opts);
toc

figure; plot(t, u(:,nb), t, cAnal(:,nb)); grid on;
xlabel('Time'); ylabel('C');
title('C at x=.075 as a function of time.');
legend('numerical', 'analytical');

timeToPlot=.1;
[dum,ti] = min(abs(x-timeToPlot));
figure; plot(x, u(ti,:), x, cAnal(ti,:), 'o'); grid on;
xlabel('x'); ylabel('C');
title(sprintf('C as a function of x at t=%g', timeToPlot));

end

function [c,f,s] = pde(x,t,u,DuDx, D, v)
nx=length(x);
c = ones(1,nx);;
f = D*DuDx;
s = -v*DuDx;
end

function u0 = ic(x,C0)
% force the IC at x=0 to be consistent with the BC
if(x==0)
u0 = C0;
else
u0=0;
end
end

function [pl,ql,pr,qr] = bc(xl,ul,xr,ur,t,C0)
pl = ul-C0;
ql = 0;
pr = 0;
qr = 1;
end

function c=uAnal(x,t,D, v, C0)
R=1;
d = 2*sqrt(D*R*t)';
c=C0/2*(erfc((R*x - v*t')./d) + exp(v*x/D).*erfc((R*x + v*t')./d));
end

(In the interest of full disclosure, I should acknowledge that I am one of the developers of pde1d.)

$\endgroup$
1
  • $\begingroup$ thanks, I'm trying to reproduce your script in a different platform, will update soon $\endgroup$
    – ToNoY
    Commented Nov 9, 2016 at 3:23
2
$\begingroup$

A couple of points:

  1. Let me start by clearing up a persistent mistake relating to the stability condition of the FTCS method you are using. The correct stability condition, derived using the von Neumann method, is $c^2 \leq 2d \leq 1$, where $c=u\Delta t/\Delta x$ and $d=\nu\Delta t/\Delta x^2$. See, for example, B.P. Leonard, Note on the von Neumann stability of the explicit FTCS convective diffusion equation, Appl. Num. Modelling, Vol. 4, pp. 401-402, 1980. The stability restrictions that must be satisfied by the time step are therefore $\Delta t\leq \frac{\Delta x^2}{2\nu}$ and $\Delta t \leq \frac{2\nu}{u^2}$. So the Peclet number does not play a role in the numerical solution of the transient convection-diffusion problem.
  2. Now regarding the discrepancy in your results. I suspect that your grid spacing and time step might not be fine enough. The reason is that you have steep gradients in your solute concentration. Have you done a systematic refinement study in both space and time? If you have not done it such a study, your result does not mean anything. (Note that you can even calculate the order of accuracy since you have the exact solution.) I assume that the position of the right boundary does not influence the results because you mention having checked this.
  3. There's something I don't understand about your IC and BC. You say that the IC is $C=0$ everywhere. Then you have a left BC of $C_0=320$, which does not look to be consistent with your computed solution, which is 0 near the left boundary. Did you mean to say that the right BC is $C_0=320$? If so, how did you implement the left BC?
  4. You ask whether the numerical approximation is good enough. I think the answer is "it depends". It depends on whether the result is good enough for your purposes. Why did you do the simulation? What quantity are you trying to predict? How accurate does that prediction have to be?
  5. You also ask whether there are better methods into which you can implement additional physical mechanisms (at least this is how I interpret your question). Yes, there are (higher order of accuracy in space (e.g., 4) and time (e.g., 2)), but implementing them requires more effort, in particular near boundaries. Depending on how many simulations you need to do and how accurate they must be, it may or may not be worth the effort.
$\endgroup$
6
  • $\begingroup$ 3. IC means for $t=0$, all $C_{0}(x)=0$; but for rest of the time, $C_{0}=320$. 1-2. what cell refinement would you then suggest for the given data? I have to look into the reference about the stability limits you indicated. $\endgroup$
    – ToNoY
    Commented Nov 7, 2016 at 17:36
  • $\begingroup$ Thanks to Brian by make the precise comment on stability. I agree with him concerning the mentioned von Neumann stability analysis that it does not depend on Peclet number. Roughly speaking this stability means that the numerical solution will not blow up, but it can have unphysical oscillations. Sometimes people mean by stability that no such oscillations will occur, but a correct notion is that a discrete minimum-maximum principle is fulfilled. So if ToNoY cares not only about stability, but also about this principle, I suggest to fulfill also the Peclet number restriction. $\endgroup$ Commented Nov 7, 2016 at 18:16
  • $\begingroup$ @ToNoY: You cannot state a priori what space and time steps are needed for your problem - you need to find them as part of a refinement study. So you start with a coarse grid (say, 33 points) and a time step that gives you stability and obtain a solution. Then you run with a finer grid (with half the grid spacing, so 65 points) and a stable time step and obtain another solution. You compare those solutions and keep refining your grid and time step until you cannot see a change in your solution anymore. Then you have obtained a grid-independent (and time-step-independent) solution. $\endgroup$ Commented Nov 7, 2016 at 18:20
  • $\begingroup$ @Peter Frolkovič: The von Neumann method will give you necessary and sufficient conditions for stability (subject to some assumptions such as periodicity, linearity, ...). You are correct that in theory the solution could have oscillations, but they will not grow in time. If you want to avoid any oscillations, you will need to satisfy more restrictive conditions that guarantee the coefficients in your approximations are all positive. Here the conditions would be $1-2d \ge 0$, $d-c/2\ge 0$, and $d+c/2\ge 0$. $\endgroup$ Commented Nov 7, 2016 at 18:24
  • $\begingroup$ @BrianZatapatique You are right, I made error in my answer, I have corrected it now. By the way, your second and third inequality is the condition on Peclet number. As in this problem $v>0$ the third one is always fulfilled. $\endgroup$ Commented Nov 7, 2016 at 18:41
1
$\begingroup$

Before comparing your particular numerical solution with the analytical one, in fact you should compare it with another numerical solution to be sure your approximation is satisfactory. If your choice of discretization steps $\Delta t$ and $\Delta x$ fulfill some stability conditions (I will comment later), it does not mean that it shall reproduce the analytical solution well.

If possible, compute another numerical solution with the space discretization step being $0.5 \Delta x$ and the time discretization steps being $0.25 \Delta t$ and compare it with the previous one. If you see no important differences, it is an indication that your numerical solution has low enough approximation error and then you can compare it with the exact solution. If you see a difference, you must continue this refinement of steps up to "convergent" numerical solution is obtained.

Concerning the stability restriction, in your case you should condider the following two ones. Firstly, if you choose the central difference for the advection, you obtain a restriction on $\Delta x$ as you should require that the (grid) Peclet number is smaller than $1$ that is in your case $$ Pe = \frac{v \Delta x}{2 D} \le 1 $$ It seems you have $Pe=1.875$. I would guess that if you plot your numerical solution after first or second time step as a function of $x$ you might see some oscillations near the left boundary, but this might be not the case and it needs not to be critical.

The second restriction is on $\Delta t$ due to the explicit in time discretization, in your case it takes the form $$ 1 - \Delta t \frac{2 D}{\Delta x^2} \ge 0 $$ In fact if you fulfill the both restrictions then all your coefficients on the right hand sides of your numerical scheme (the terms before $C_{x, t-\Delta t}$ and so on) are nonnegative.

Concerning your question about better numerical approximation, it depends what do you want to solve next (as for this equation you have the analytical solution). The drawback of your scheme is your restriction on the time step due to the choice of explicit in time discretization, but if you can leave with the two above restrictions and if your research is not on numerical methods, you might use this method that can be applied also for more general 1D equation.

P.S. This part of answer was added after some issues were cleared in comments.

You should compare not only the breakthrough curve, it means $C$ at $x=0.075$ as a function of time, but also compare numerical and analytical solution at some fixed time, e.g. $t=0.15$, as a function of $x$. I suppose you might observe a difference due to the boundary condition at the right point that might explain behavior of your numerical breakthrough curve and that might suggest you where to place the right point of your interval (now 1.74).

There is a problematic issues with this boundary condition: $$ \frac{\partial C}{\partial x}(L,t) = 0 $$ If you define it at finite distance, say $L=1.74$, then your analytical solution is not valid and for some time interval the difference might be large. Simply plot the exact solution and observe for which time interval the condition is not fulfilled.

Another point is how did you implement this boundary condition for advection-dispersion equation, but this might be now not so important.

$\endgroup$
4
  • $\begingroup$ I agree with the suggestion regarding mesh refinement. When time is near zero, there is a very sharp gradient in C near x=0 that will require a relatively fine mesh to capture. I believe that is the reason for the big difference between the solutions for t<0.1 days. $\endgroup$ Commented Nov 6, 2016 at 13:55
  • $\begingroup$ This seems to be some misunderstanding. The Peclet number is not depending on $\Delta t$, but on $\Delta x$. And my notation should be understand to take one half of your origin $\Delta x$ when it gets $0.009375$, and one quarter of $\Delta t$ when it gets $0.00125$, so you must compute on once refined grid with 4 times more time steps. The question is then if your numerical breakthrough curve does change significantly from the one you plotted. $\endgroup$ Commented Nov 6, 2016 at 14:21
  • $\begingroup$ Ok- I found that I was using a $D$ value one order of magnitude higher for the analytical solution- I fixed the problem and the new solutions are attached. It looks much better but the plateau time is still not the same $\endgroup$
    – ToNoY
    Commented Nov 6, 2016 at 17:25
  • $\begingroup$ Good news. I tried to guess what is the reason for the difference now, see my addition in my answer. $\endgroup$ Commented Nov 6, 2016 at 18:55

Your Answer

By clicking “Post Your Answer”, you agree to our terms of service and acknowledge you have read our privacy policy.

Not the answer you're looking for? Browse other questions tagged or ask your own question.