Summarizing and formulating the answer:
(part of it was already given in the comments by user14717, Christian Clason, and Kirill)
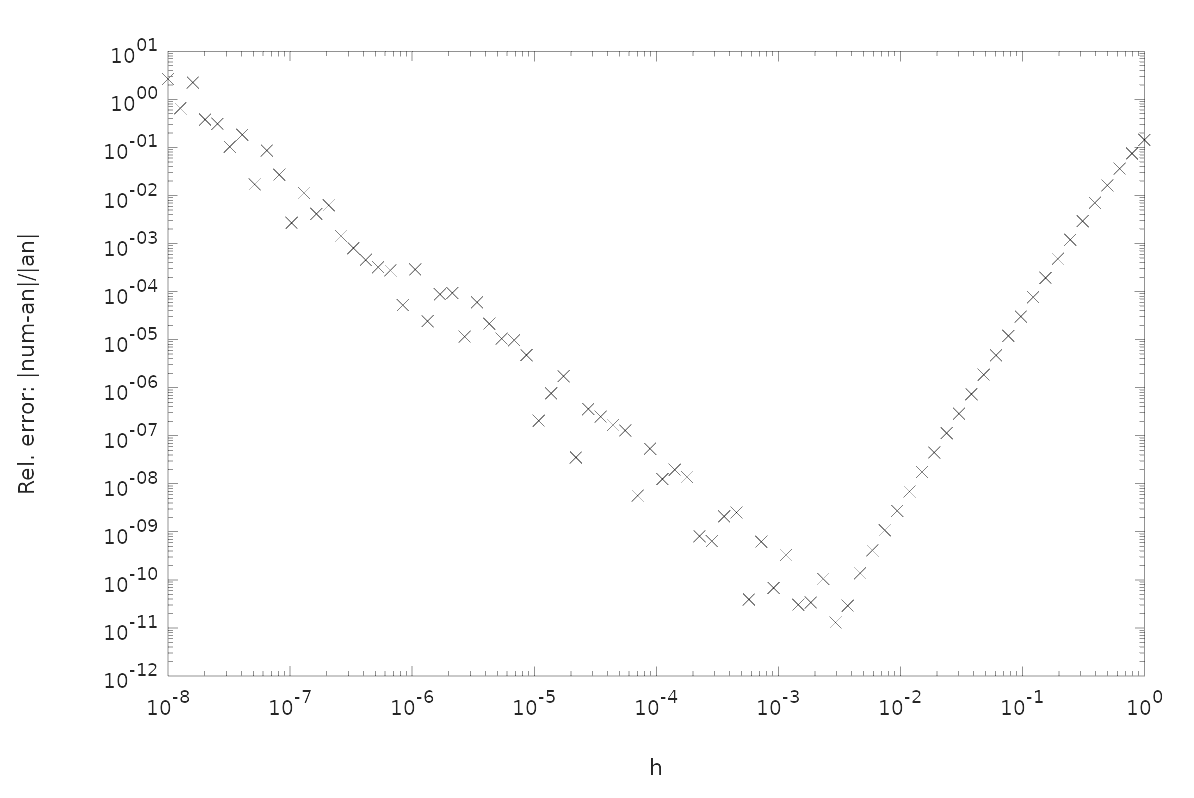
While performing numerical differentiation using finite differences, one would observe two sources of error: truncation and rounding. Truncation error (for simplicity, what order terms are truncated from the Taylor series expansion) will be determined by a discretization scheme that is being used and will decrease with $h$. Unfortunately, that will be eventually stopped by an increase in the rounding error. Therefore, there usually exists an optimal discretization step $h$ when the total error (the combined effect of Taylor series truncation and rounding in finite-precision arithmetic) is minimal. Certainly, this value depends on the discretization scheme, function under-approximation, chosen point, etc. So, one would expect to see a plot that is similar to the following one:

Here, I plot the relative error in the approximation of the second derivative using your scheme vs analytical derivative as a function of the step size $h$.
Since you are using a standard five-point stencil for a second-order derivative, the error is expected to drop as $\mathcal O(h^4)$, until you hit $h\approx5\cdot 10^{-3}$. At this point, the rounding error starts dominating and we see the oscillations in the relative error together with its gradual increase. However, using this scheme you are able to get 10 significant digits from your derivative pretty safely using double precision, which I would say is a very reasonable result.
If interested, you might invest your time adjusting your discretization scheme, increased precision (vpa), etc.
A couple of minor notes:
loglog plots are usually very useful when studying refinements, errors, timings, etc.- a line on the plot usually implies continuity of the data; in this particular case, where you are using finite differences at discrete points, markers are preferred, in my opinion.
Slightly modified Octave code:
x = pi/2;
stps = logspace(-8,0,80);
numpoints = size(stps,2);
outs = zeros(numpoints,1);
analytic = ones(numpoints,1)*(cos(x)^2 - sin(x))*exp(sin(x));
for i=1:numpoints
  h=stps(i);
  coefficients = [-5/2 -1/12 4/3 4/3 -1/12]./h^2;
  steps = [0 -2 -1 1 2].*h;
  outs(i) = sum(coefficients .* exp(sin(x + steps)));
end

figure(1)
loglog(stps',abs(outs-analytic)./abs(analytic),"kx");hold on;
xlim([1E-8,1E-0]);   ylim([1E-12,1E+1]);
xlabel("h");         ylabel("Rel. error: |num-an|/|an|");


format longonly affects the terminal output, not the internal accuracy -- it makes no difference here. $\endgroup$vpa(which is not a silver bullet). $\endgroup$