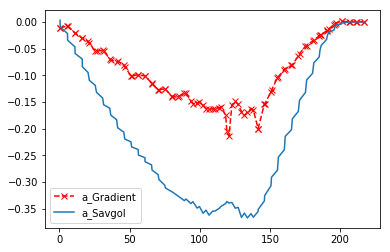
I am trying to take the numerical derivative of a dataset. My first attempt was to use the gradient function from numpy but in that case the graph of the derivative looked not "smooth enough". So I tried to calculate it with the savgol filter from the scipy.signal library but now I get a wrong scale:
import matplotlib.pyplot as plt
import pandas as pd
from numpy import *
import scipy.signal
data = pd.read_csv('data.dat',header=0,sep=',',decimal=".")
data['a_Gradient'] = gradient(data.v,data.t)
data['a_Savgol'] = scipy.signal.savgol_filter(data.v, window_length=11, polyorder=2, deriv=1)
plot(data.t,data.a_Gradient,'rx--')
plot(data.t,data.a_Savgol)
plt.legend()
Where data.dat looks like
t,v
0.424,27.0807
0.52,27.0796
5.728,27.0268
5.823,27.0261
11.032,26.9747
11.127,26.9727
16.218,26.813
16.336,26.8094
20.367,26.6891
21.309,26.6534
25.459,26.4396
26.399,26.3876
30.764,26.1607
31.49,26.1217
35.856,25.854
36.58,25.8028
40.736,25.4843
41.458,25.4308
45.829,25.1174
46.549,25.0587
50.922,24.6318
51.426,24.5805
56.014,24.1311
56.304,24.1023
60.895,23.6316
60.969,23.6241
65.635,23.1459
65.988,23.1052
70.3,22.5615
70.869,22.489
74.965,21.9771
75.538,21.905
79.842,21.3396
80.419,21.2592
84.295,20.7021
85.3,20.5608
88.96,20.0647
90.181,19.9027
93.625,19.4272
95.063,19.2091
98.078,18.7366
99.732,18.4878
102.318,18.0991
104.401,17.7648
106.559,17.4086
109.282,16.965
110.799,16.718
113.952,16.2013
115.04,16.0275
118.409,15.4924
119.28,15.3369
120.764,14.9651
122.866,14.6239
125.217,14.2745
127.323,13.9592
129.669,13.584
131.78,13.2139
133.909,12.8403
136.45,12.4257
138.15,12.1498
141.542,11.5654
141.543,11.5652
145.995,10.8749
146.213,10.8413
150.66,10.1843
151.094,10.1279
155.325,9.653
155.975,9.5859
160.203,9.1748
160.856,9.117
165.293,8.7496
165.948,8.6962
170.171,8.3776
171.041,8.3242
175.261,8.1118
176.133,8.0723
180.352,7.8991
181.225,7.8686
185.044,7.7552
185.655,7.7394
186.529,7.7177
190.348,7.6393
190.746,7.6328
191.833,7.6169
195.652,7.5812
196.05,7.5794
197.136,7.5764
200.956,7.5786
201.353,7.579
206.259,7.5788
206.657,7.5787
211.563,7.5783
211.96,7.5783
216.867,7.578
217.264,7.5779
So, what did I do wrong and how to fix it? Is there a better way to get a smooth derivative of this data?
