*Concern highlighted in yellow
*Solution at bottom
I have a differential equation to solve for the motion of an electron:
$$ \frac{d^2v}{dt^2} = \frac{1}{\gamma^6}\left( \frac{eE}{\tau m} - \left( \frac{\gamma}{\tau} \frac{dv}{dt} + \frac{\gamma^3}{\tau c^2} v^2 \frac{dv}{dt} + 6\frac{\gamma^8}{c^2} v \left( \frac{dv}{dt} \right)^2\right) \right) $$
$$ \gamma = \frac{1}{\sqrt{1-v^2/c^2}}\\ e = 1.6\times 10^{-19}\\ E = 10^6\\ \tau = 6\times 10^{-24}\\ m = 9.1\times 10^{-31}\\ c = 3\times10^8 $$
With initial conditions $$v(0) = 0$$ $$\frac{dv}{dt}\biggr\rvert_0 = Ee/m \approx 6\times 10^{-4}$$
But I heard that it is good practice to make everything dimensionless so that your computer can handle things nicely, so I introduced some dimensionless variables:
$$ T = t/\tau\\ V = v/c\\ \varepsilon = \frac{\tau e}{cm} E $$
This gets me to the final form:
$$ \frac{d^2V}{dT^2} = \frac{1}{\gamma^6}\left( \varepsilon - \left( \gamma \frac{dV}{dT} + \gamma^3 V^2 \frac{dV}{dT} + 6\gamma^8 V \left( \frac{dV}{dT} \right) ^2 \right)\right) $$
With initial conditions
$$ V(0) = 0\\ \frac{dV}{dT}\biggr\rvert_0 = \varepsilon \approx 4\times 10^{-15} $$
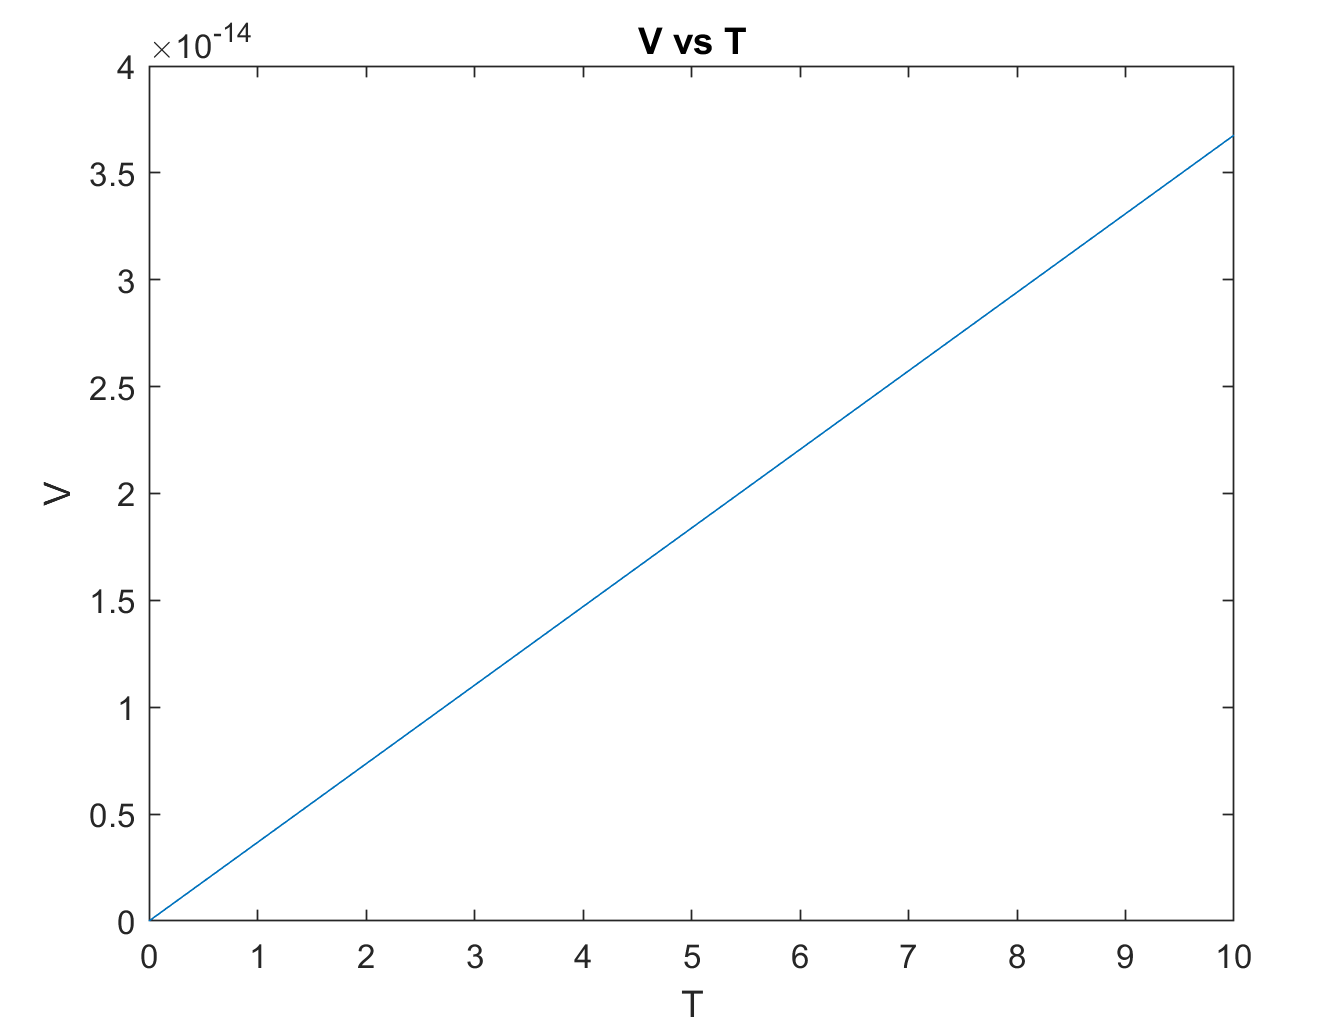
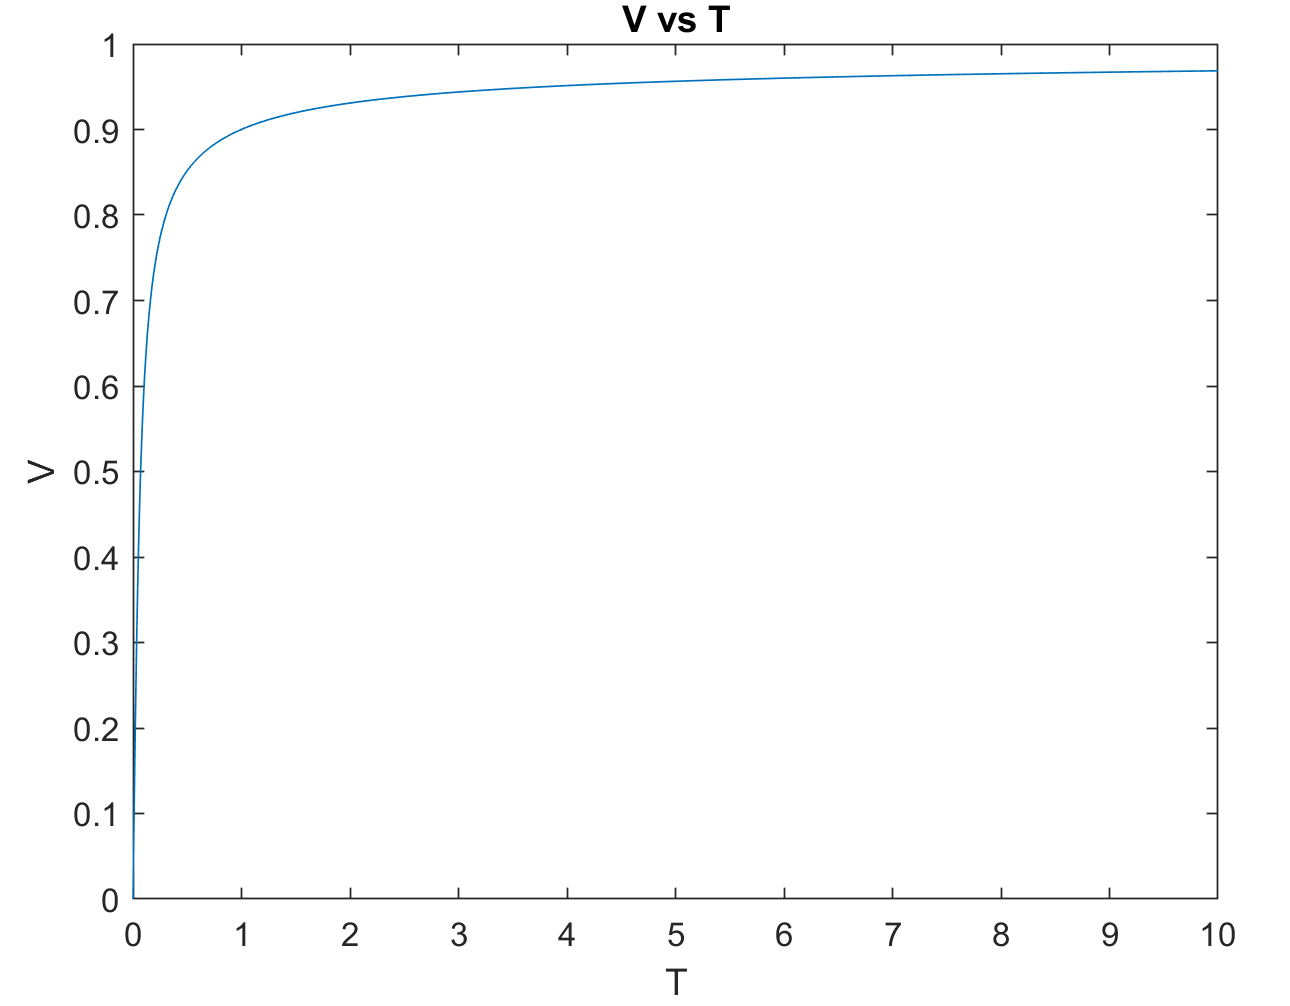
I am using MATLAB's ode45 to solve this, but I do not think it can handle such small initial conditions. The plot should rapidly asymptote to 1, but I can only get that to happen with fairly large initial conditions:
Initial acceleration equal to $\varepsilon$
Initial acceleration equal to $10$
I can't tell what the issue is, but I'll post my code - it's not very long:
Script for the Differential Equation
function dv2dt = emDeq(t, v)
mu = 4*pi*10^(-7);
c = physconst('LightSpeed');
e = 1.6022e-19;
m = 9.1094e-31;
tau = mu*e^2/(6*pi*m*c);

E = (10^6)*(tau*e)/(c*m);
% E = 1e6;

gam = (1 - v(1)^2)^(-1/2);

dv2dt = [v(2); (gam^(-6))*( E  - ( gam*v(2) + (gam^3)*(v(1))^2*v(2) + 6*(gam^8)*v(1)*(v(2))^2 ) )];

end
Script for Plotting
mu = 4*pi*10^(-7);
c = physconst('LightSpeed');
e = 1.6022e-19;
m = 9.1094e-31;
tau = (mu*e^2)/(6*pi*m*c);
E = (10^6)*(tau*e)/(c*m);
% E = 1e6;

v0 = 0;
a0 = E;
% a0 = E*e/m;
[t, v] = ode45(@emDeq, [0, 10], [v0, a0]);
figure('Color', 'w')
plot(t, v(:,1));
title('V vs T'); xlabel('T'); ylabel('V');
Solution
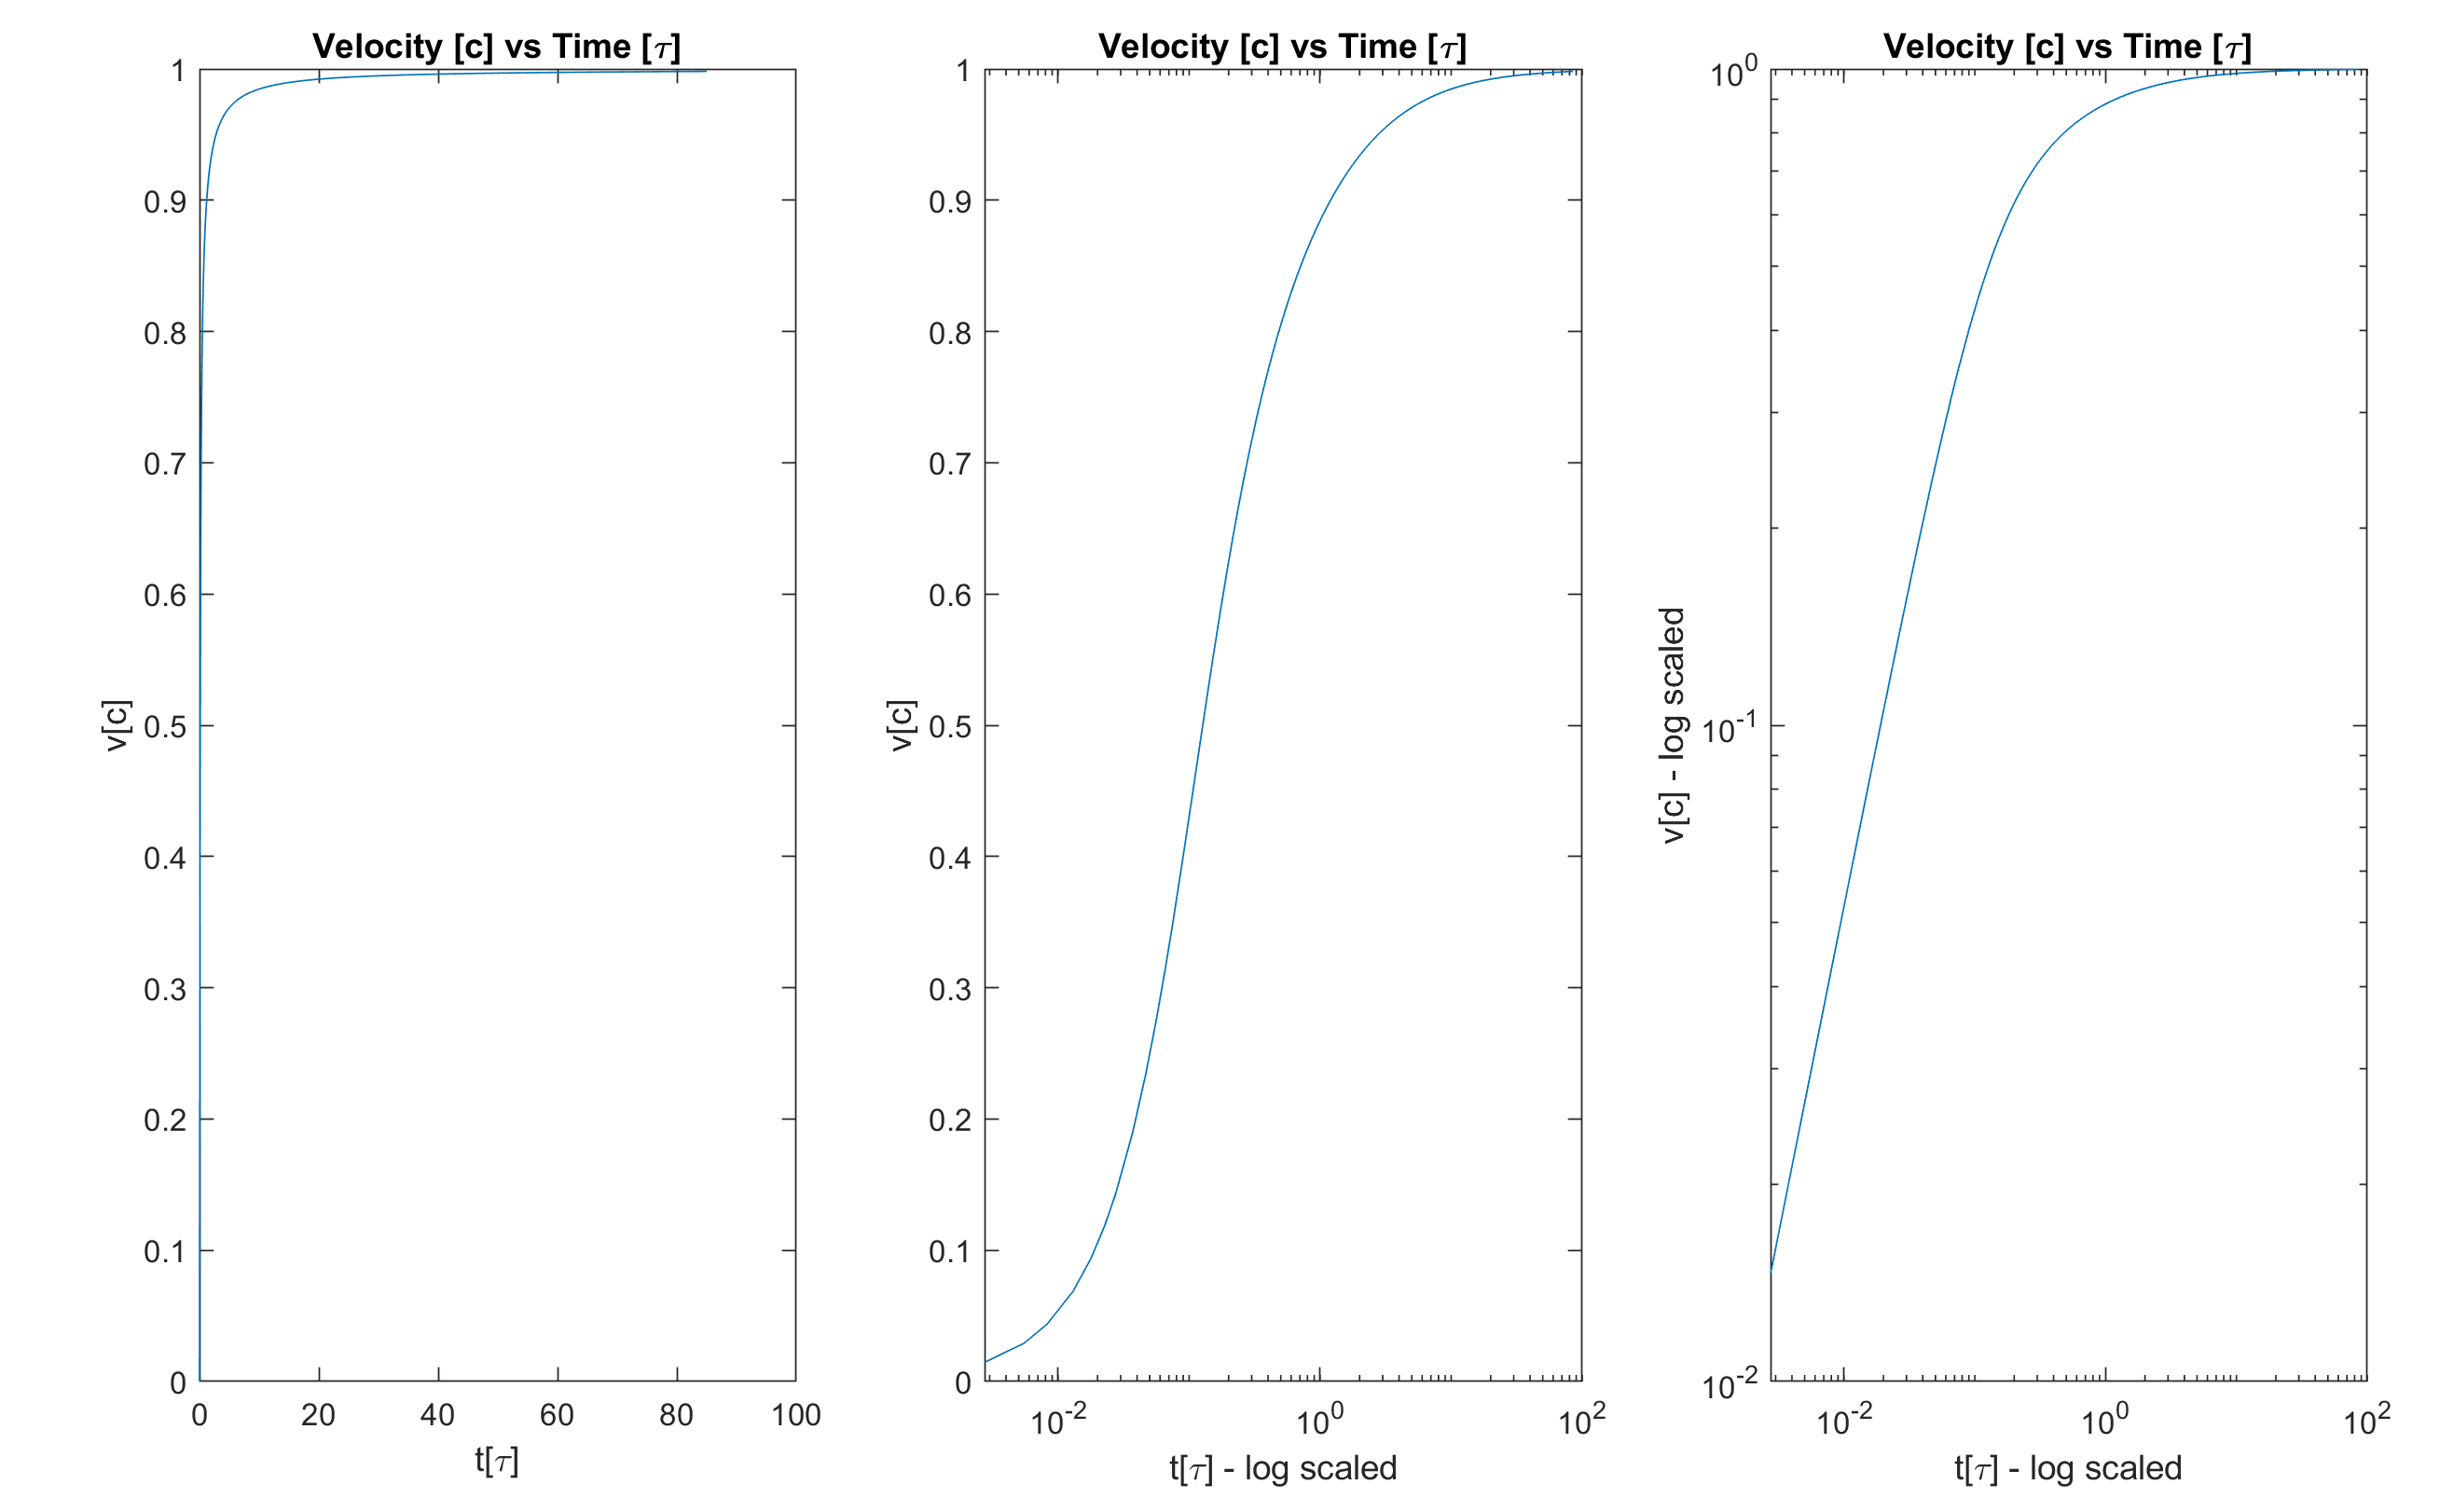
I needed to redefine length scales and time scales, as well as use either ode15s or ode23s.
1 time step is $\tau$s, one length step is $10^{-15}$m, one voltage step is $10^{-10}$. This got me a reasonable $\epsilon$ to work with. Plots below. Thanks to everyone who helped out!


