6
$\begingroup$

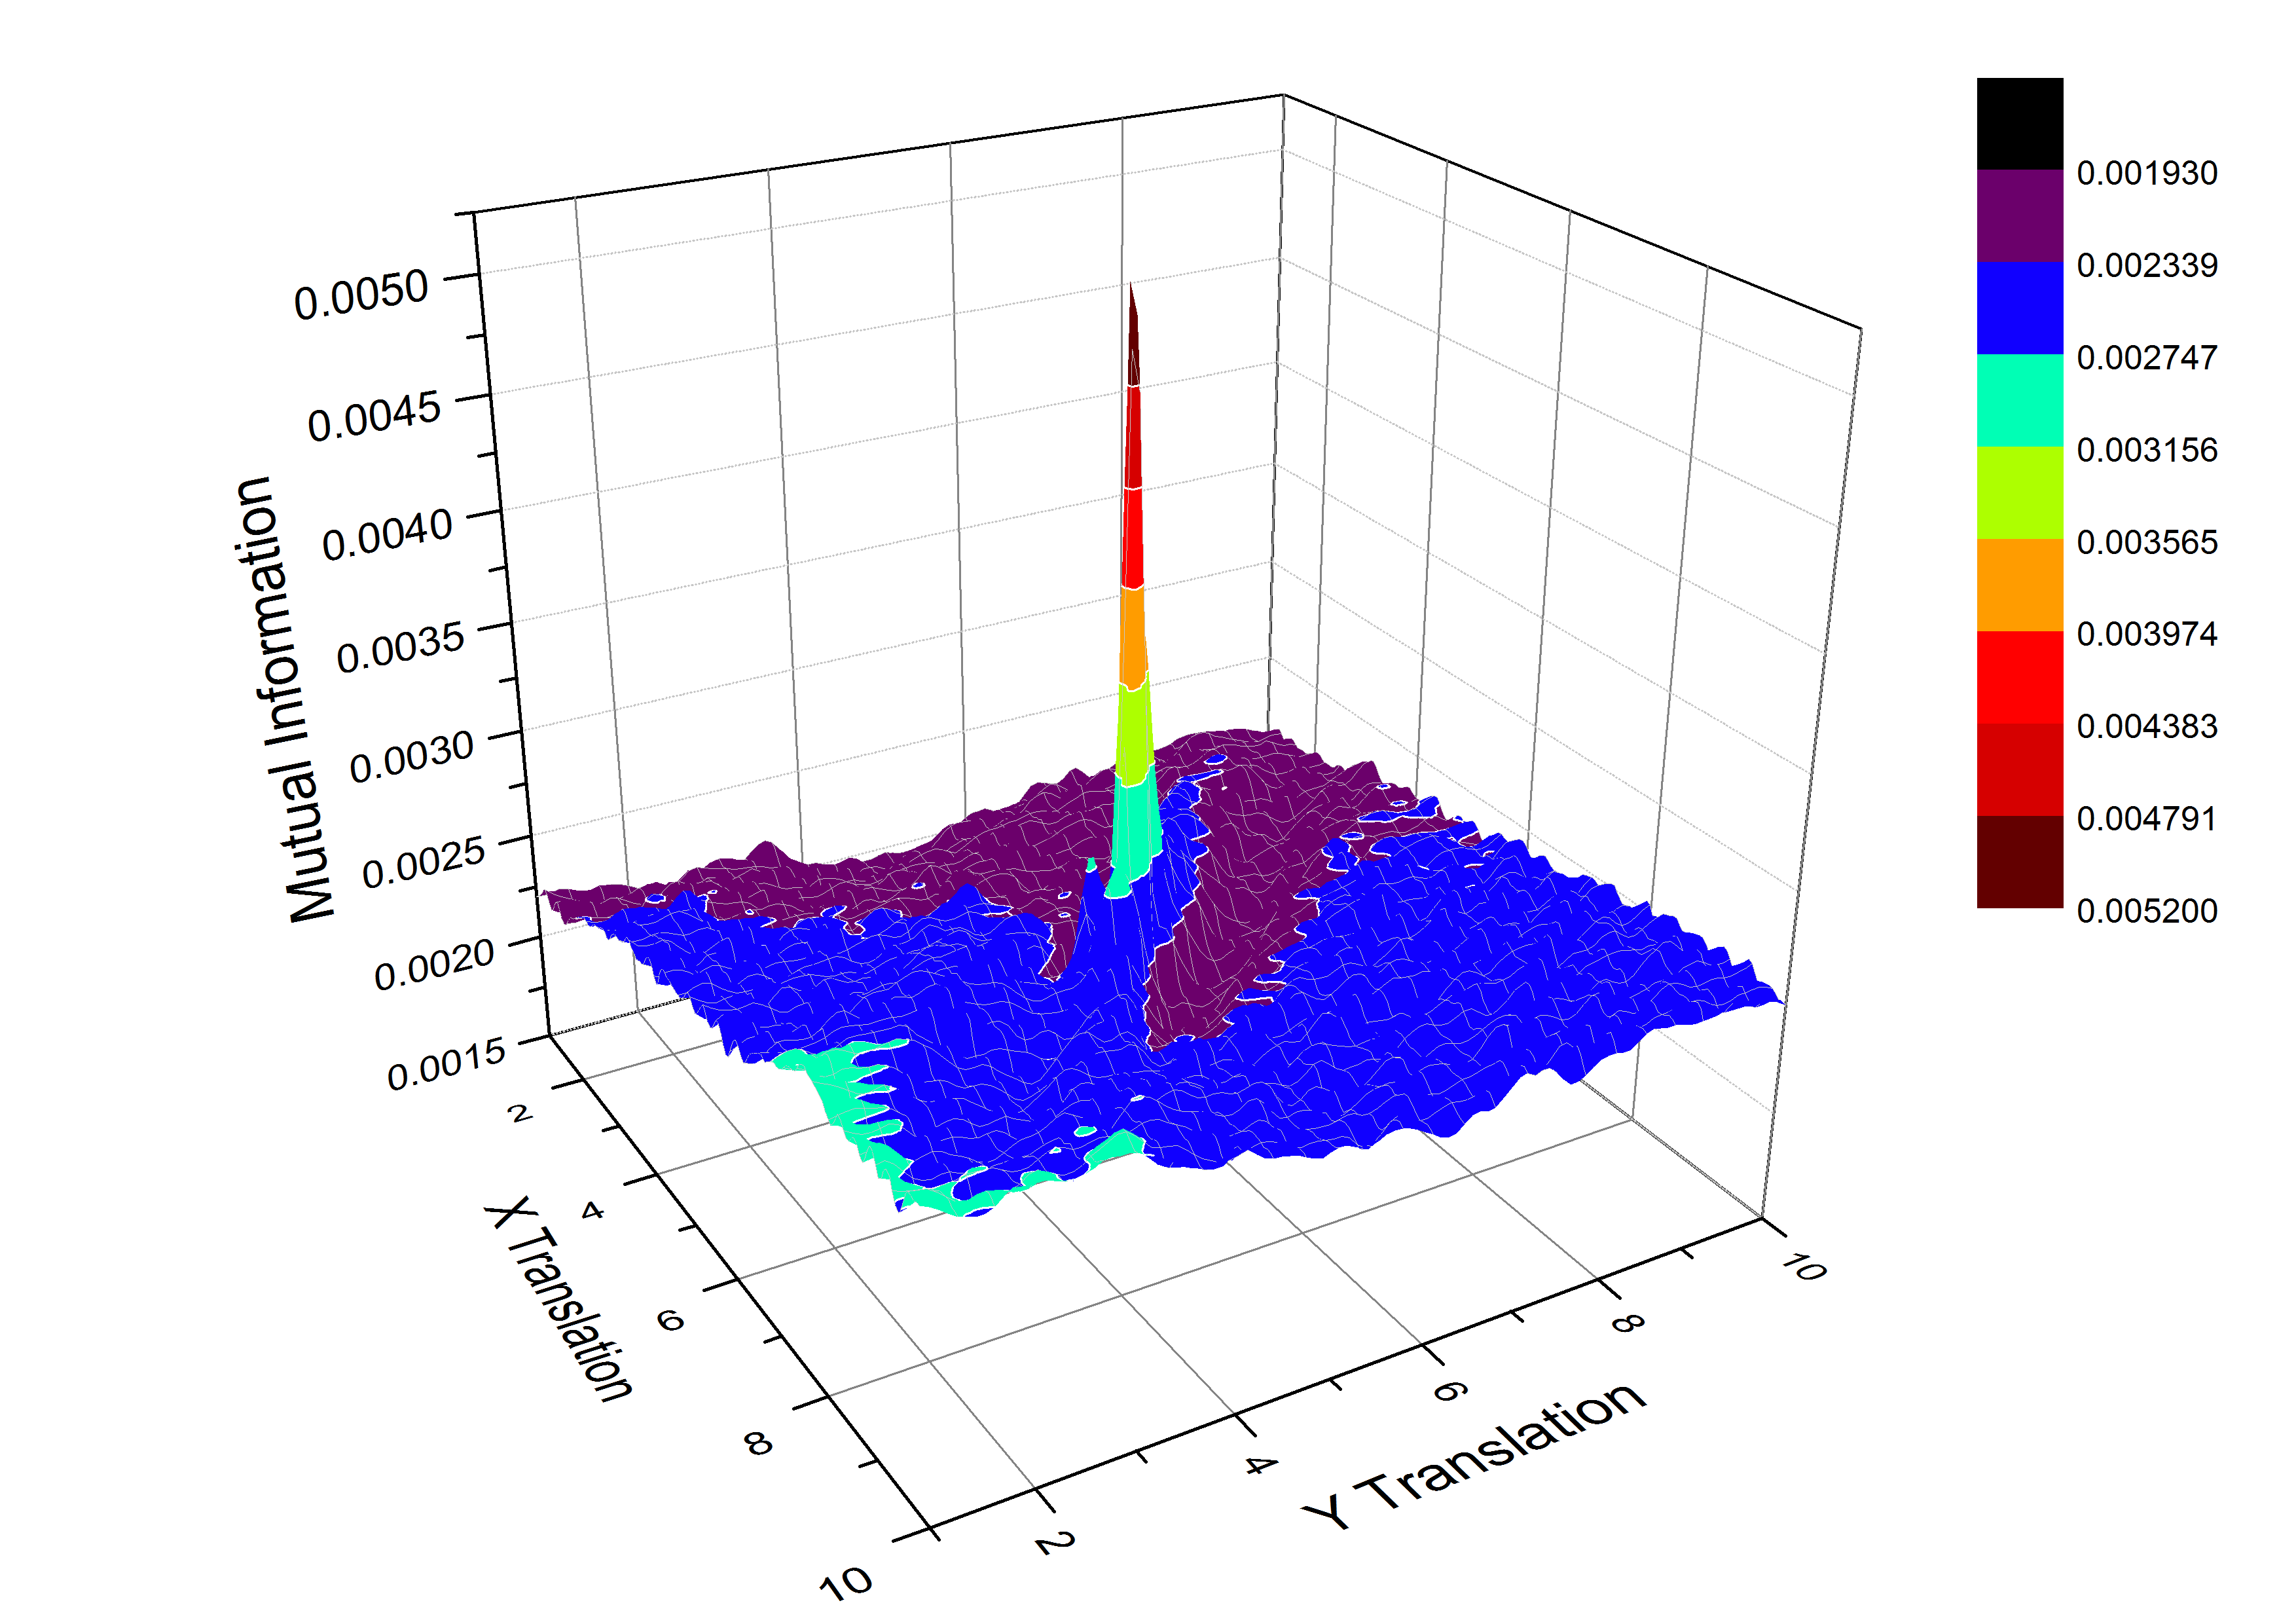
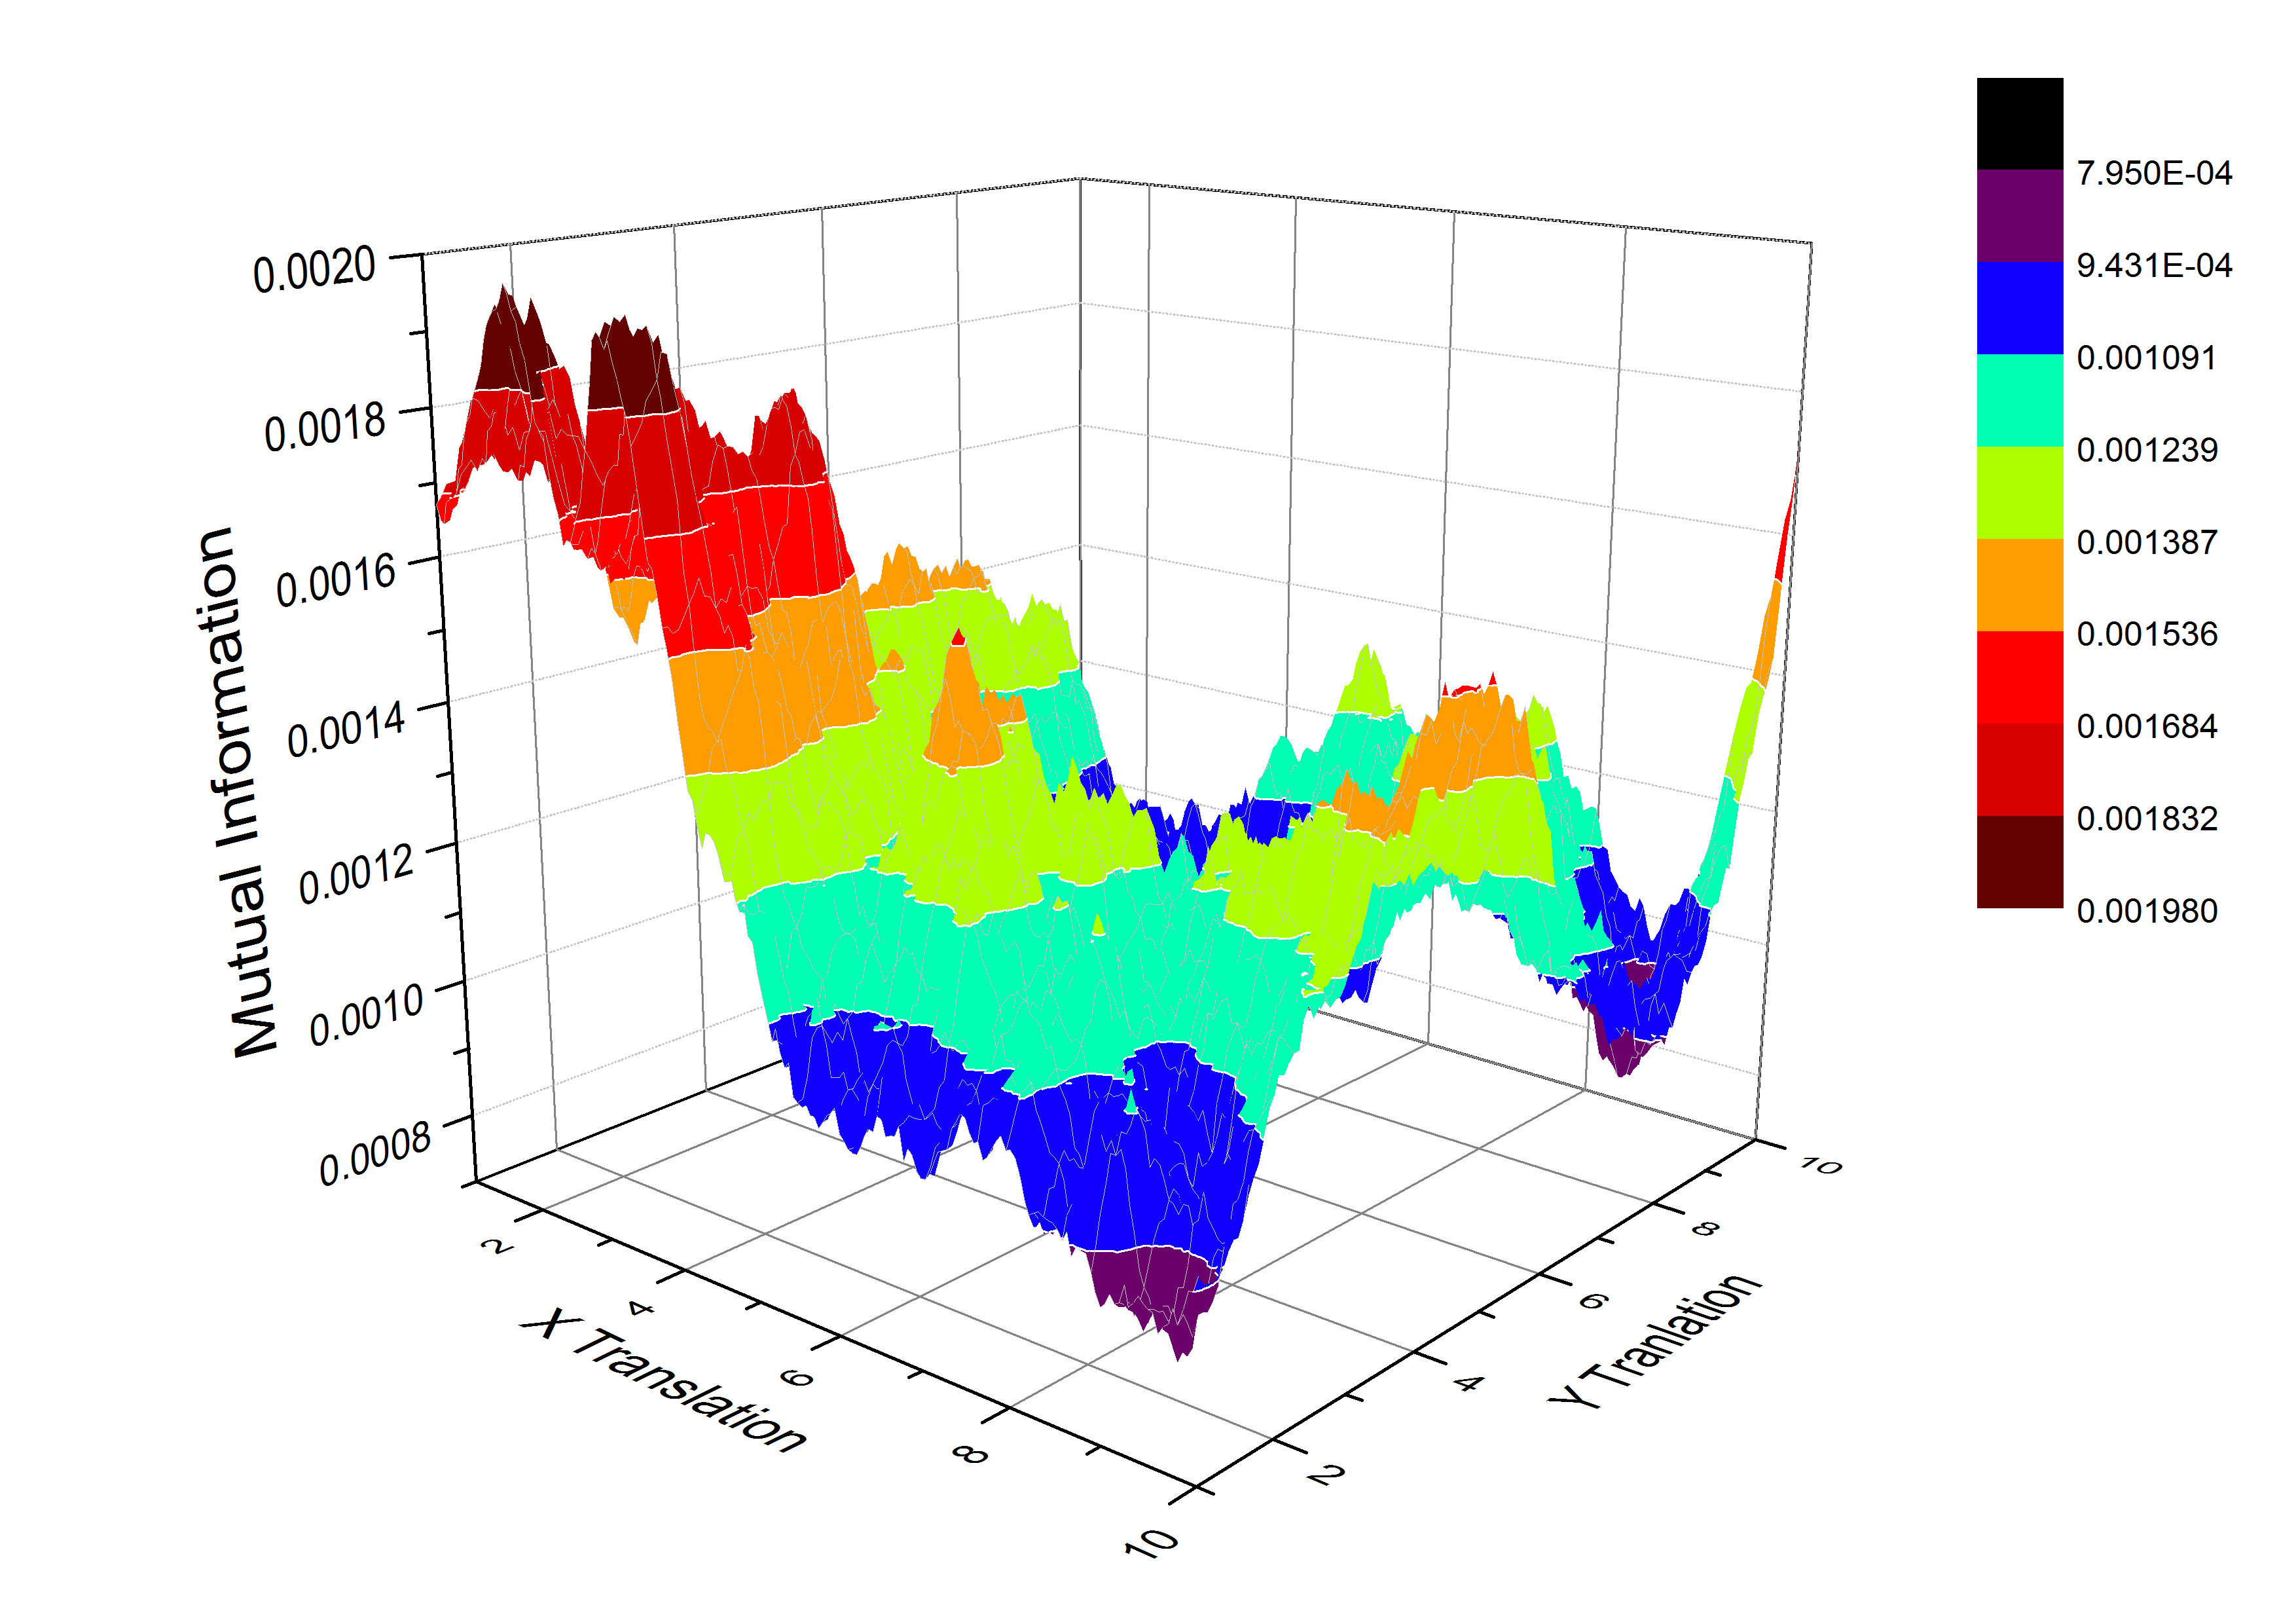
I have a program which compares the similarity of two images for different positions, so my surface consists of points which correspond to X and Y translations each with a value (mutual information).

Here is an example of a surface I want to be ranked as very good:
https://dl.dropboxusercontent.com/u/51282958/good.png

And this is an example of surface which needs a low rank:
https://dl.dropboxusercontent.com/u/51282958/bad.png

So the metric is some kind of measure of certainty, lots of similar peaks = bad and one big peak in center of the surface is good. Also a peak on the border of the surface is bad as it might not be a peak at all.

Now I've already created some kind of metric to rank these surfaces, and it does work in some cases. What I would really like to know is if there is some mathematical or computational method well defined to do this kind of ranking?

I have extracted information such as the location of maxima and standard deviations. Also this surface is sometimes up to 6 dimensional when rotation and scale are included.

EDIT: My current metric works as follows:

  • Finds the coordinates of each local maximum

  • Starts with a score of 1 and then reduces this for each maximum it finds by a percentage, this percentage is calculated by looking at how similar the local maximum is to the global maximum. Hence if you have a lot of maxima similar to the global maxima you will get a low score. The issue with this technique at the moment is that it was designed when I had images which only generated typically under 10 maxima but I now have images with over 500 maxima and so my score goes very low when it should not.

  • Finally there is a correction depending on how many standard deviations away form the mean the global maximum is.

I'm planning on improving how step two scales and so I'll hopefully be able to get rid of the last step (as it feels fairly subjective).

$\endgroup$
5
  • $\begingroup$ Is this being used for image/surface alignment? If so there are a bit easier ways. Mutual information is a good measure of some things, but typically has a poorly behaving derivative. A little more information about what you are trying to do? $\endgroup$
    – meawoppl
    Commented Aug 7, 2013 at 16:42
  • $\begingroup$ It would help to hear what metric you have developed and what your reasoning was. $\endgroup$ Commented Aug 7, 2013 at 19:26
  • $\begingroup$ @WolfgangBangerth added as an edit above. $\endgroup$
    – Luka Milic
    Commented Aug 7, 2013 at 20:25
  • $\begingroup$ @meawoppl I would be very interested in better ways. I am trying to create a metric which gives an already functioning piece of software the ability to know how well the image matching process went. This is for matching satellite images together $\endgroup$
    – Luka Milic
    Commented Aug 7, 2013 at 20:30
  • $\begingroup$ Ahh, so 6-d comes from the symmetric tensor deformation to map between the two? Also, how stable is your satellite orbit? What is the attitude, and orbit parameters? $\endgroup$
    – meawoppl
    Commented Aug 10, 2013 at 16:59

1 Answer 1

3
$\begingroup$

The quantity you are measuring currently is something akin to "prominence" which is a better formed topographical quantity than numerical one. The wiki page in that link describes all sorts of strange cases that arise, even without having any image/surface borders to worry about.

If you want to stick with this alignment metric I would suggest using a watershed transform on the gradient image to find the area that your peaks encompass.

For a conceptual motivation of what is going on, imagine turning those plots upside down then filling them with water. This will give you a segmentation between your peaks (lakes) which you can use to calculate the quantities you actually care about. I suspect what will be good is the mean peak height, aka peak volume / peak surface area.

In the flat noisy graph, this quantity will come out largely similar for each peak, in the one with the prominent peak there will be a really significant outlier in the distribution.

It sounds like this is being done on satellite/aerial imagery, so my final suggestion would be adding an additional metric on the deformation tensor, the trace of the deformation matrix should be constant for a given altitude, and solutions found outside that constant should also be penalized. You can do similar things with the off-diagonal terms knowing the trajectory of your travel in the images being compared.

$\endgroup$

Your Answer

By clicking “Post Your Answer”, you agree to our terms of service and acknowledge you have read our privacy policy.

Not the answer you're looking for? Browse other questions tagged or ask your own question.