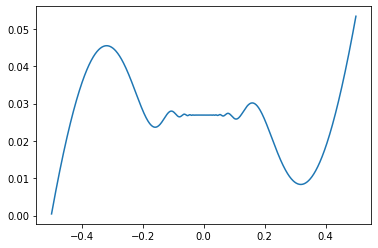
I want to plot a numerical integral function of some function $f$ using scipy and matplotlib. How can I do this?
I tried the following but it didn't work (run with ipython %pylab):
import numpy as np
from scipy import integrate

def f(x):
    return x*np.sin(1/x)

X = np.arange(-0.5,0.5,0.001)

#plot(X,f(X))

def F(x):
    return integrate.quad(f,0,x)

plot(X,F(X))
I also tried to vectorize the function F without success.
