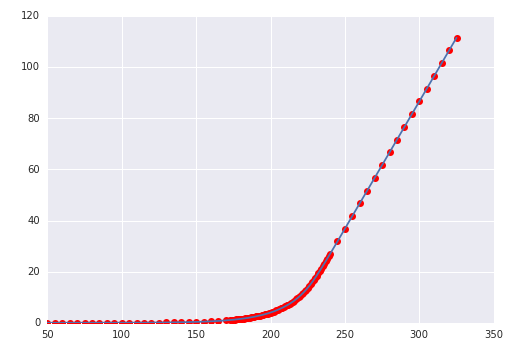
I'm trying to take data in numpy arrays, interpolate them and retrieve this function to differentiate/integrate at different stages.
Here is how I got here, data included:
import numpy as np

x = np.array([  50.,   55.,   60.,   65.,   70.,   75.,   80.,   85.,   90.,
         95.,  100.,  105.,  110.,  115.,  120.,  125.,  130.,  135.,
        140.,  145.,  150.,  155.,  160.,  165.,  170.,  173.,  174.,
        175.,  176.,  177.,  178.,  179.,  180.,  181.,  182.,  183.,
        184.,  185.,  186.,  187.,  188.,  189.,  190.,  191.,  192.,
        193.,  194.,  195.,  196.,  197.,  198.,  199.,  200.,  201.,
        202.,  203.,  204.,  205.,  206.,  207.,  208.,  209.,  210.,
        211.,  212.,  213.,  214.,  215.,  216.,  217.,  218.,  219.,
        220.,  221.,  222.,  223.,  224.,  225.,  226.,  227.,  228.,
        229.,  230.,  231.,  232.,  233.,  234.,  235.,  236.,  237.,
        238.,  239.,  240.,  245.,  250.,  255.,  260.,  265.,  270.,
        275.,  280.,  285.,  290.,  295.,  300.,  305.,  310.,  315.,
        320.,  325.])

y = np.array([  1.00000000e-02,   1.00000000e-02,   1.00000000e-02,
         1.00000000e-02,   1.00000000e-02,   1.00000000e-02,
         1.00000000e-02,   1.50000000e-02,   2.00000000e-02,
         2.50000000e-02,   3.50000000e-02,   4.00000000e-02,
         5.00000000e-02,   6.00000000e-02,   8.00000000e-02,
         1.05000000e-01,   1.30000000e-01,   1.70000000e-01,
         2.20000000e-01,   2.75000000e-01,   3.50000000e-01,
         4.50000000e-01,   5.75000000e-01,   7.30000000e-01,
         9.40000000e-01,   1.08500000e+00,   1.14000000e+00,
         1.19500000e+00,   1.25500000e+00,   1.32000000e+00,
         1.38500000e+00,   1.45000000e+00,   1.52500000e+00,
         1.60000000e+00,   1.68000000e+00,   1.76500000e+00,
         1.84500000e+00,   1.94000000e+00,   2.03500000e+00,
         2.13500000e+00,   2.24000000e+00,   2.35000000e+00,
         2.47500000e+00,   2.59000000e+00,   2.72500000e+00,
         2.85000000e+00,   2.99000000e+00,   3.15000000e+00,
         3.29500000e+00,   3.46500000e+00,   3.63000000e+00,
         3.81500000e+00,   4.00500000e+00,   4.20500000e+00,
         4.41500000e+00,   4.62500000e+00,   4.86500000e+00,
         5.10500000e+00,   5.36000000e+00,   5.62000000e+00,
         5.89500000e+00,   6.18000000e+00,   6.49000000e+00,
         6.80500000e+00,   7.14000000e+00,   7.49500000e+00,
         7.87000000e+00,   8.26000000e+00,   8.68500000e+00,
         9.12500000e+00,   9.58500000e+00,   1.00800000e+01,
         1.06000000e+01,   1.11500000e+01,   1.17300000e+01,
         1.23400000e+01,   1.29850000e+01,   1.36650000e+01,
         1.43700000e+01,   1.51150000e+01,   1.58900000e+01,
         1.67000000e+01,   1.75450000e+01,   1.84200000e+01,
         1.93150000e+01,   2.02200000e+01,   2.11600000e+01,
         2.20800000e+01,   2.30300000e+01,   2.39950000e+01,
         2.49600000e+01,   2.59400000e+01,   2.69150000e+01,
         3.18400000e+01,   3.68050000e+01,   4.17550000e+01,
         4.67450000e+01,   5.17150000e+01,   5.66950000e+01,
         6.16750000e+01,   6.66600000e+01,   7.16350000e+01,
         7.66150000e+01,   8.15900000e+01,   8.65700000e+01,
         9.15500000e+01,   9.65300000e+01,   1.01520000e+02,
         1.06490000e+02,   1.11470000e+02])
With some assistance, I got to this point.
import matplotlib.pyplot as plt
from scipy.interpolate import UnivariateSpline

y_spl = UnivariateSpline(x,y,s=0,k=4)
x_range = np.linspace(x[0],x[-1],1000)

plt.plot(x,y,'ro',label = 'data')
plt.plot(x_range,y_spl(x_range))
This seems like a reasonably good fit. I want to take this polynomial and retrieve its results symbolically, because my numerical derivatives appear unnatural, even for this spline.
y_spl_2d = y_spl.derivative(n=2)
plt.plot(x_range,y_spl_2d(x_range))
I think even visually, this second derivative just doesn't cut it. The initial function appears pretty "smooth" in a math-sense.
What are my options from here? Can I retrieve the initial function symbolically and perform the derivative this way (analytically?). What other numerical procedures can I implement to smooth my second derivative? It doesn't appear to me at any point that my second derivative should be negative (and in a modeling sense with what I'm physically modeling, it should never be negative).
Can I retrieve the polynomial from the fit, or can I make numerical modifications to smooth my second derivative?
Edit: the goal is to retrieve a probability density function. I would also like to restrict this final derivative to be strictly positive and integrate to 1, but I think my problems are bigger than this right now. Those are secondary issues.
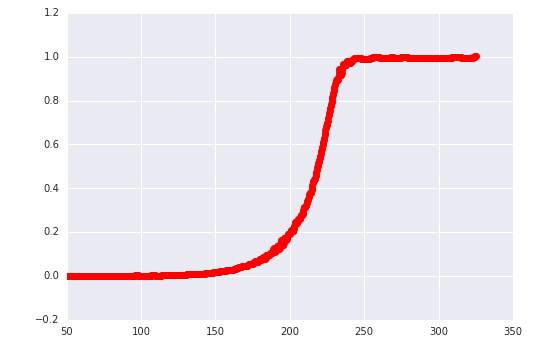
Here is the first derivative, which looks like a very fine-looking CDF, so I'm becoming more and more sure that my problems are numerical. Should I interpolate this result, as well, and differentiate? I'm sure these problems are very common - what are my next steps.
y_spl_2d = y_spl.derivative(n=1)
plt.plot(x_range,y_spl_2d(x_range), 'ro')


