Tweeted twitter.com/#!/StackSciComp/status/368796155351539712
added 536 characters in body
Source Link
torbonde
  • 491
  • 1
  • 5
  • 13

I have written some code, to produce some data. In what I have shown below, the output is just one-dimensional array of numbers. I have an analytical expression for what the autocorrelation function of this data should look like. My problem is, that it doesn't look like that, when I use matlabs built-in function xcorr. I don't know why that is, but I was hoping some of you might be able to tell me.

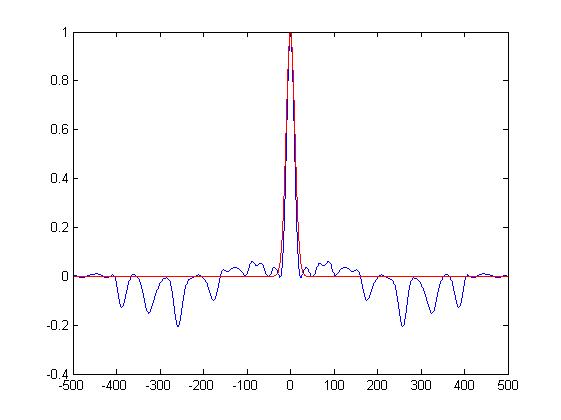
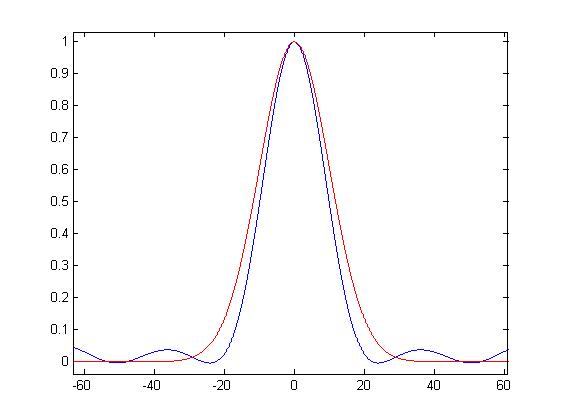
I have attached two graphs, to show you what I mean. The graphs herein are normalized, by the way. The red graph is the expected autocorrelation function, and the blue is the measured one. (Sorry for the horrible images - I don't know why matlab does that).
enter image description here enter image description here

As you can see, there seem to be some sort of oscillations, or something like that. Is that to be expected?

This is actually somewhat of a toy-example. The code I really (really) need to get working, produces a 4D array - actually a discretized 3D vector field. The measured autocorrelation of this output is far uglier than this. I will upload some graphs in a while.

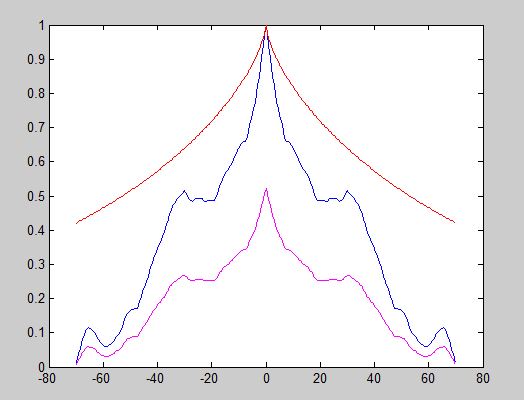
UPDATE: Here is a graph showing the measured autocorrelation of the produced 3D vector field. Once again, sorry for the poor quality. The blue graph shows the output of xcorr(V,'coef'), the purple graph shows the output of xcorr(V,'biased') and the red is how it is actually supposed to look. If I move the purple graph, so that its maximum is 1, the middle part of the graph is pretty close to the red graph - but is this just a coincidence? enter image description here
I have written some code, to produce some data. In what I have shown below, the output is just one-dimensional array of numbers. I have an analytical expression for what the autocorrelation function of this data should look like. My problem is, that it doesn't look like that, when I use matlabs built-in function xcorr. I don't know why that is, but I was hoping some of you might be able to tell me.

I have attached two graphs, to show you what I mean. The graphs herein are normalized, by the way. The red graph is the expected autocorrelation function, and the blue is the measured one. (Sorry for the horrible images - I don't know why matlab does that).

enter image description here enter image description here

As you can see, there seem to be some sort of oscillations, or something like that. Is that to be expected?

This is actually somewhat of a toy-example. The code I really (really) need to get working, produces a 4D array - actually a discretized 3D vector field. The measured autocorrelation of this output is far uglier than this. I will upload some graphs in a while.

UPDATE: Here is a graph showing the measured autocorrelation of the produced 3D vector field. Once again, sorry for the poor quality. The blue graph shows the output of xcorr(V,'coef'), the purple graph shows the output of xcorr(V,'biased') and the red is how it is actually supposed to look. If I move the purple graph, so that its maximum is 1, the middle part of the graph is pretty close to the red graph - but is this just a coincidence? enter image description here

Source Link
torbonde
  • 491
  • 1
  • 5
  • 13

Autocorrelation problems

I have written some code, to produce some data. In what I have shown below, the output is just one-dimensional array of numbers. I have an analytical expression for what the autocorrelation function of this data should look like. My problem is, that it doesn't look like that, when I use matlabs built-in function xcorr. I don't know why that is, but I was hoping some of you might be able to tell me.

I have attached two graphs, to show you what I mean. The graphs herein are normalized, by the way. The red graph is the expected autocorrelation function, and the blue is the measured one. (Sorry for the horrible images - I don't know why matlab does that).

enter image description here enter image description here

As you can see, there seem to be some sort of oscillations, or something like that. Is that to be expected?

This is actually somewhat of a toy-example. The code I really (really) need to get working, produces a 4D array - actually a discretized 3D vector field. The measured autocorrelation of this output is far uglier than this. I will upload some graphs in a while.