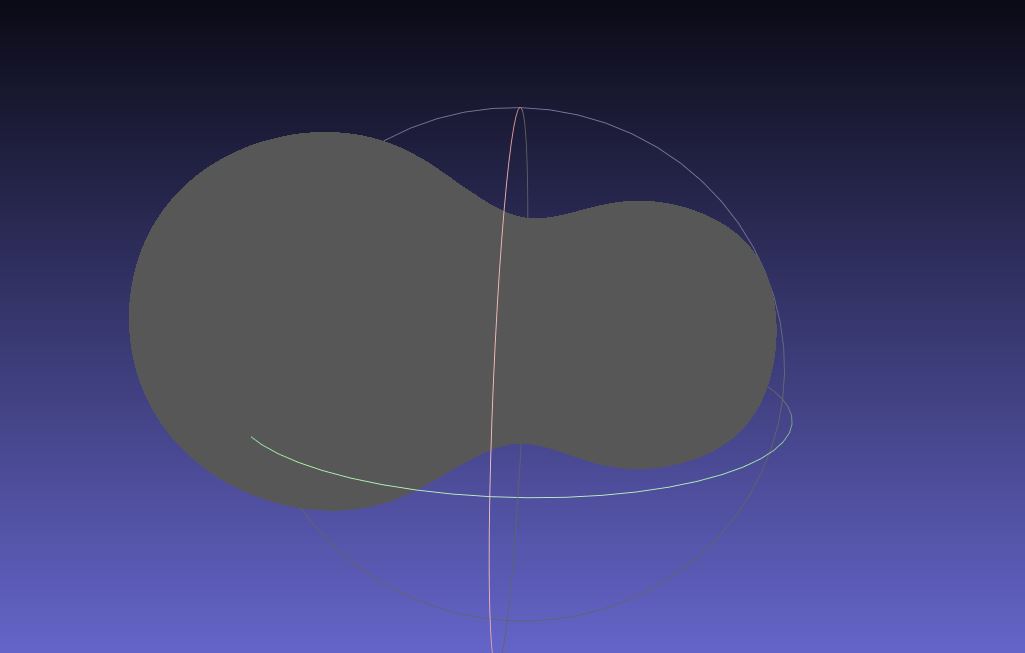
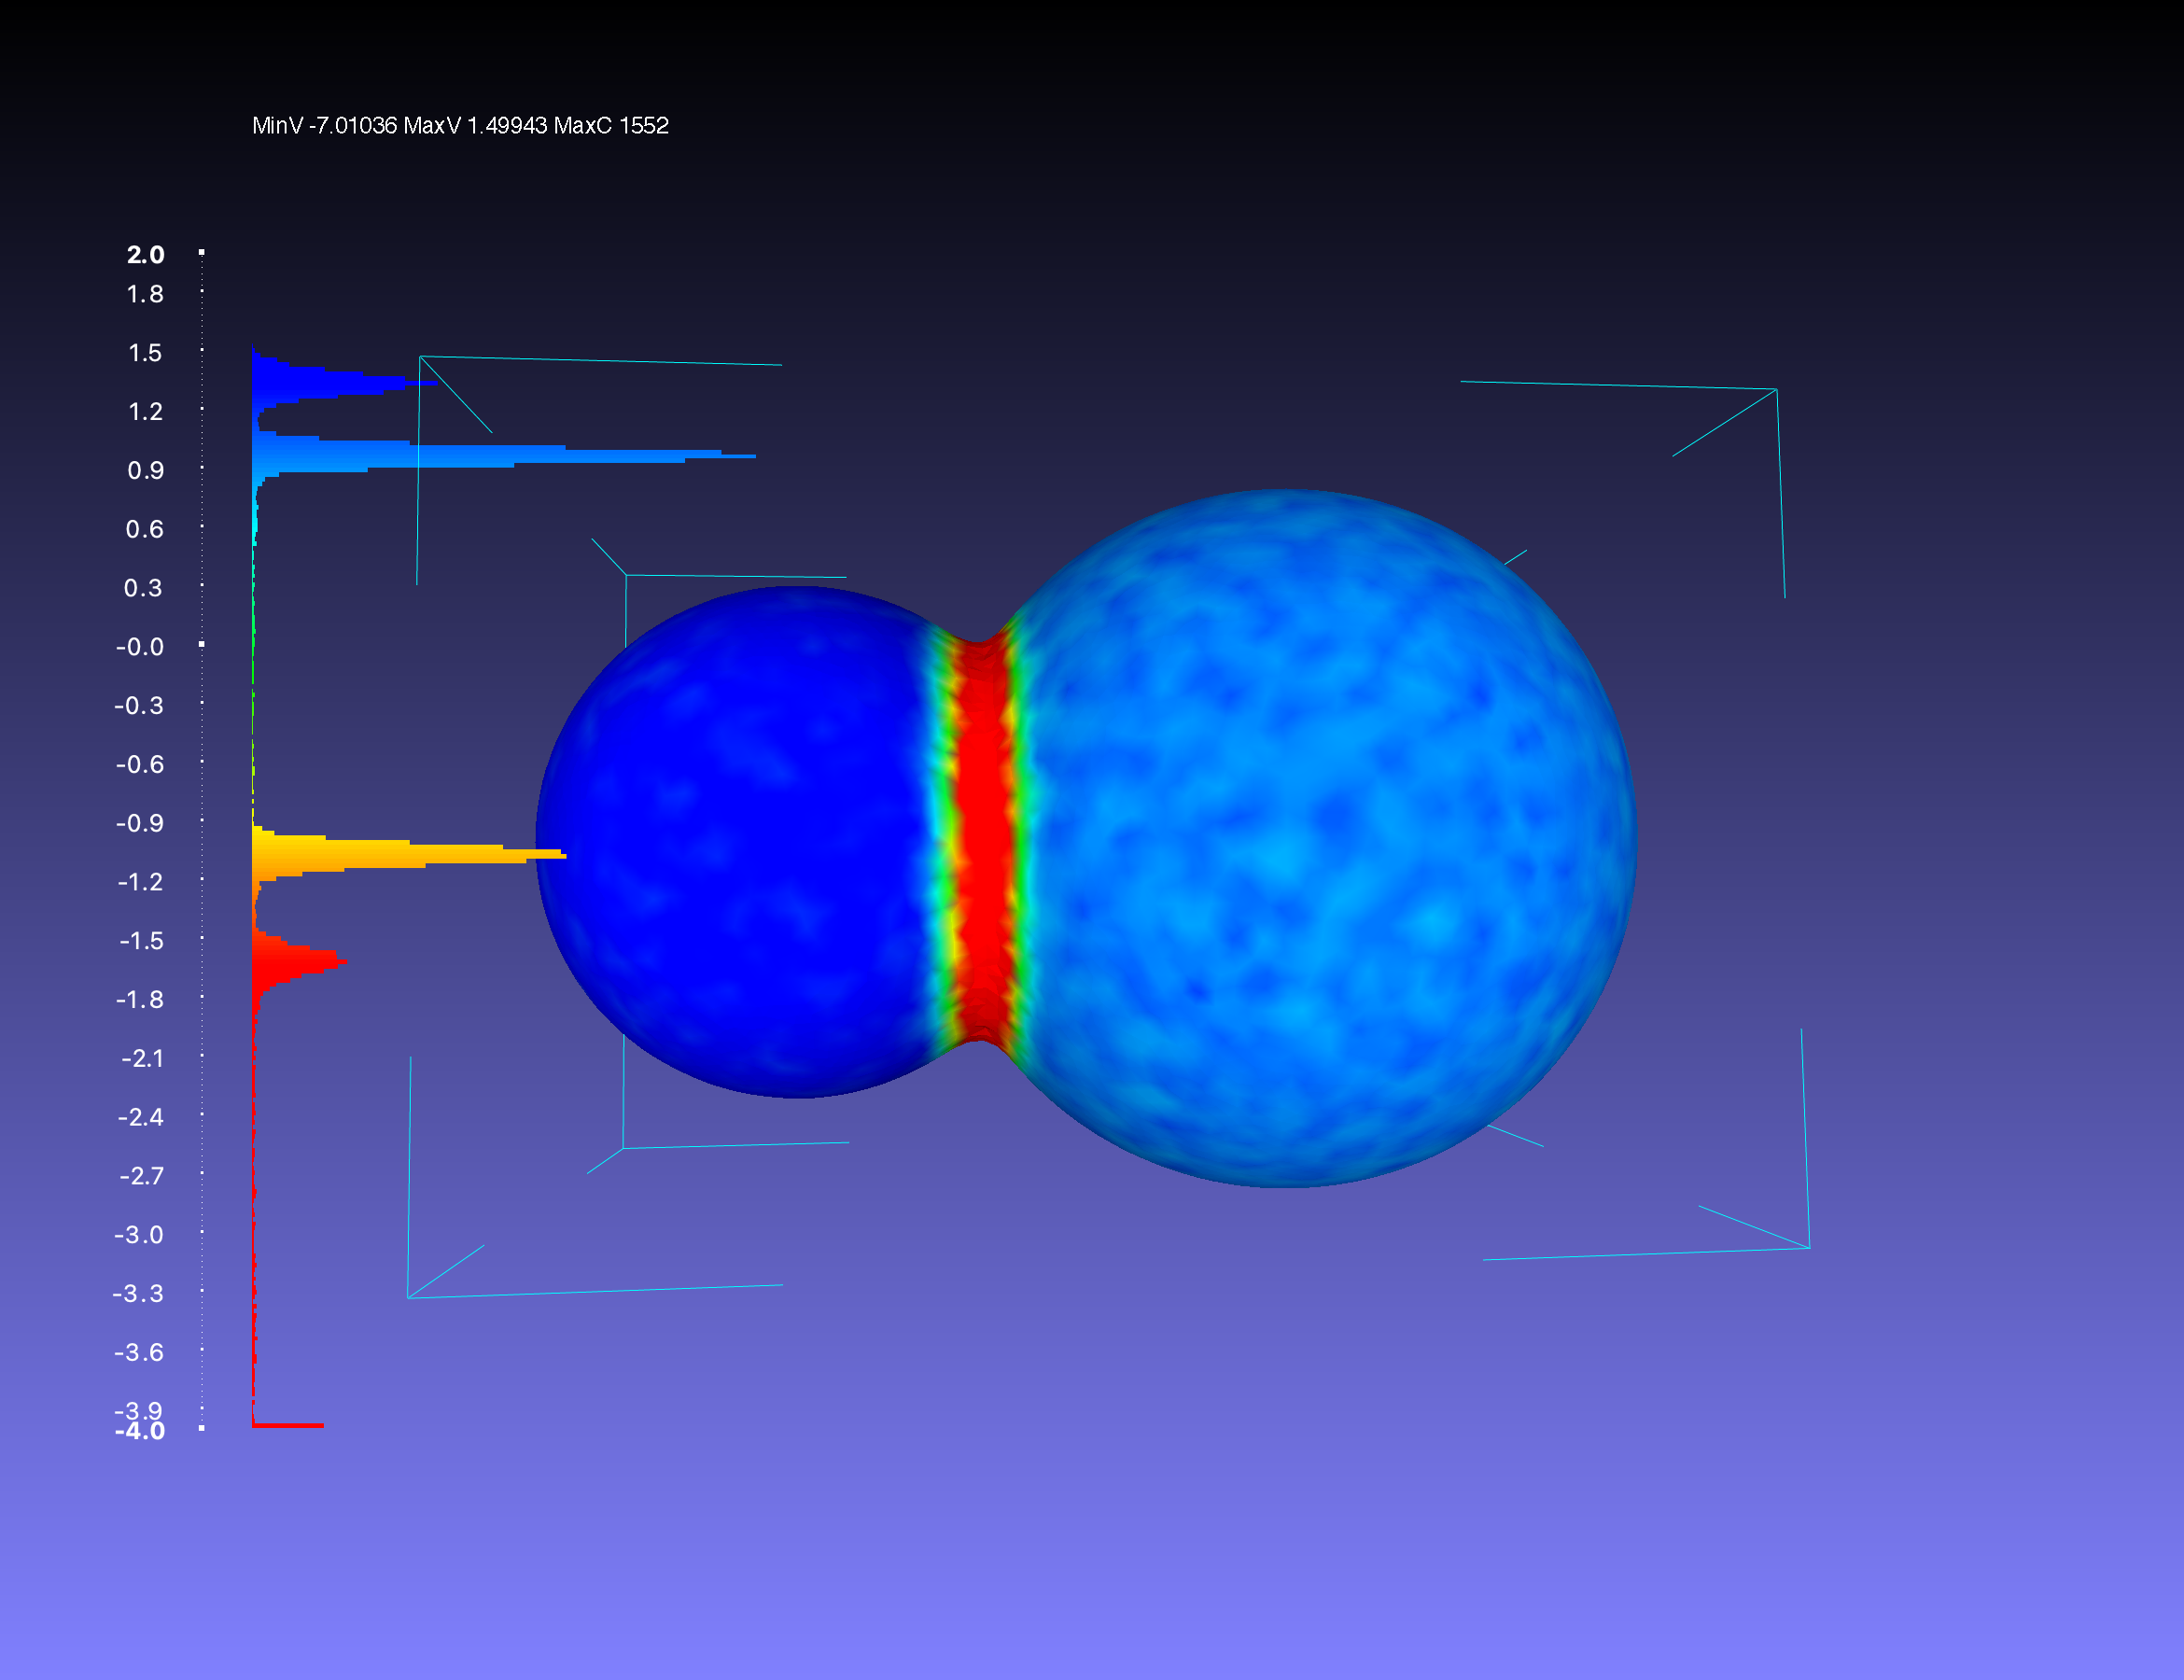
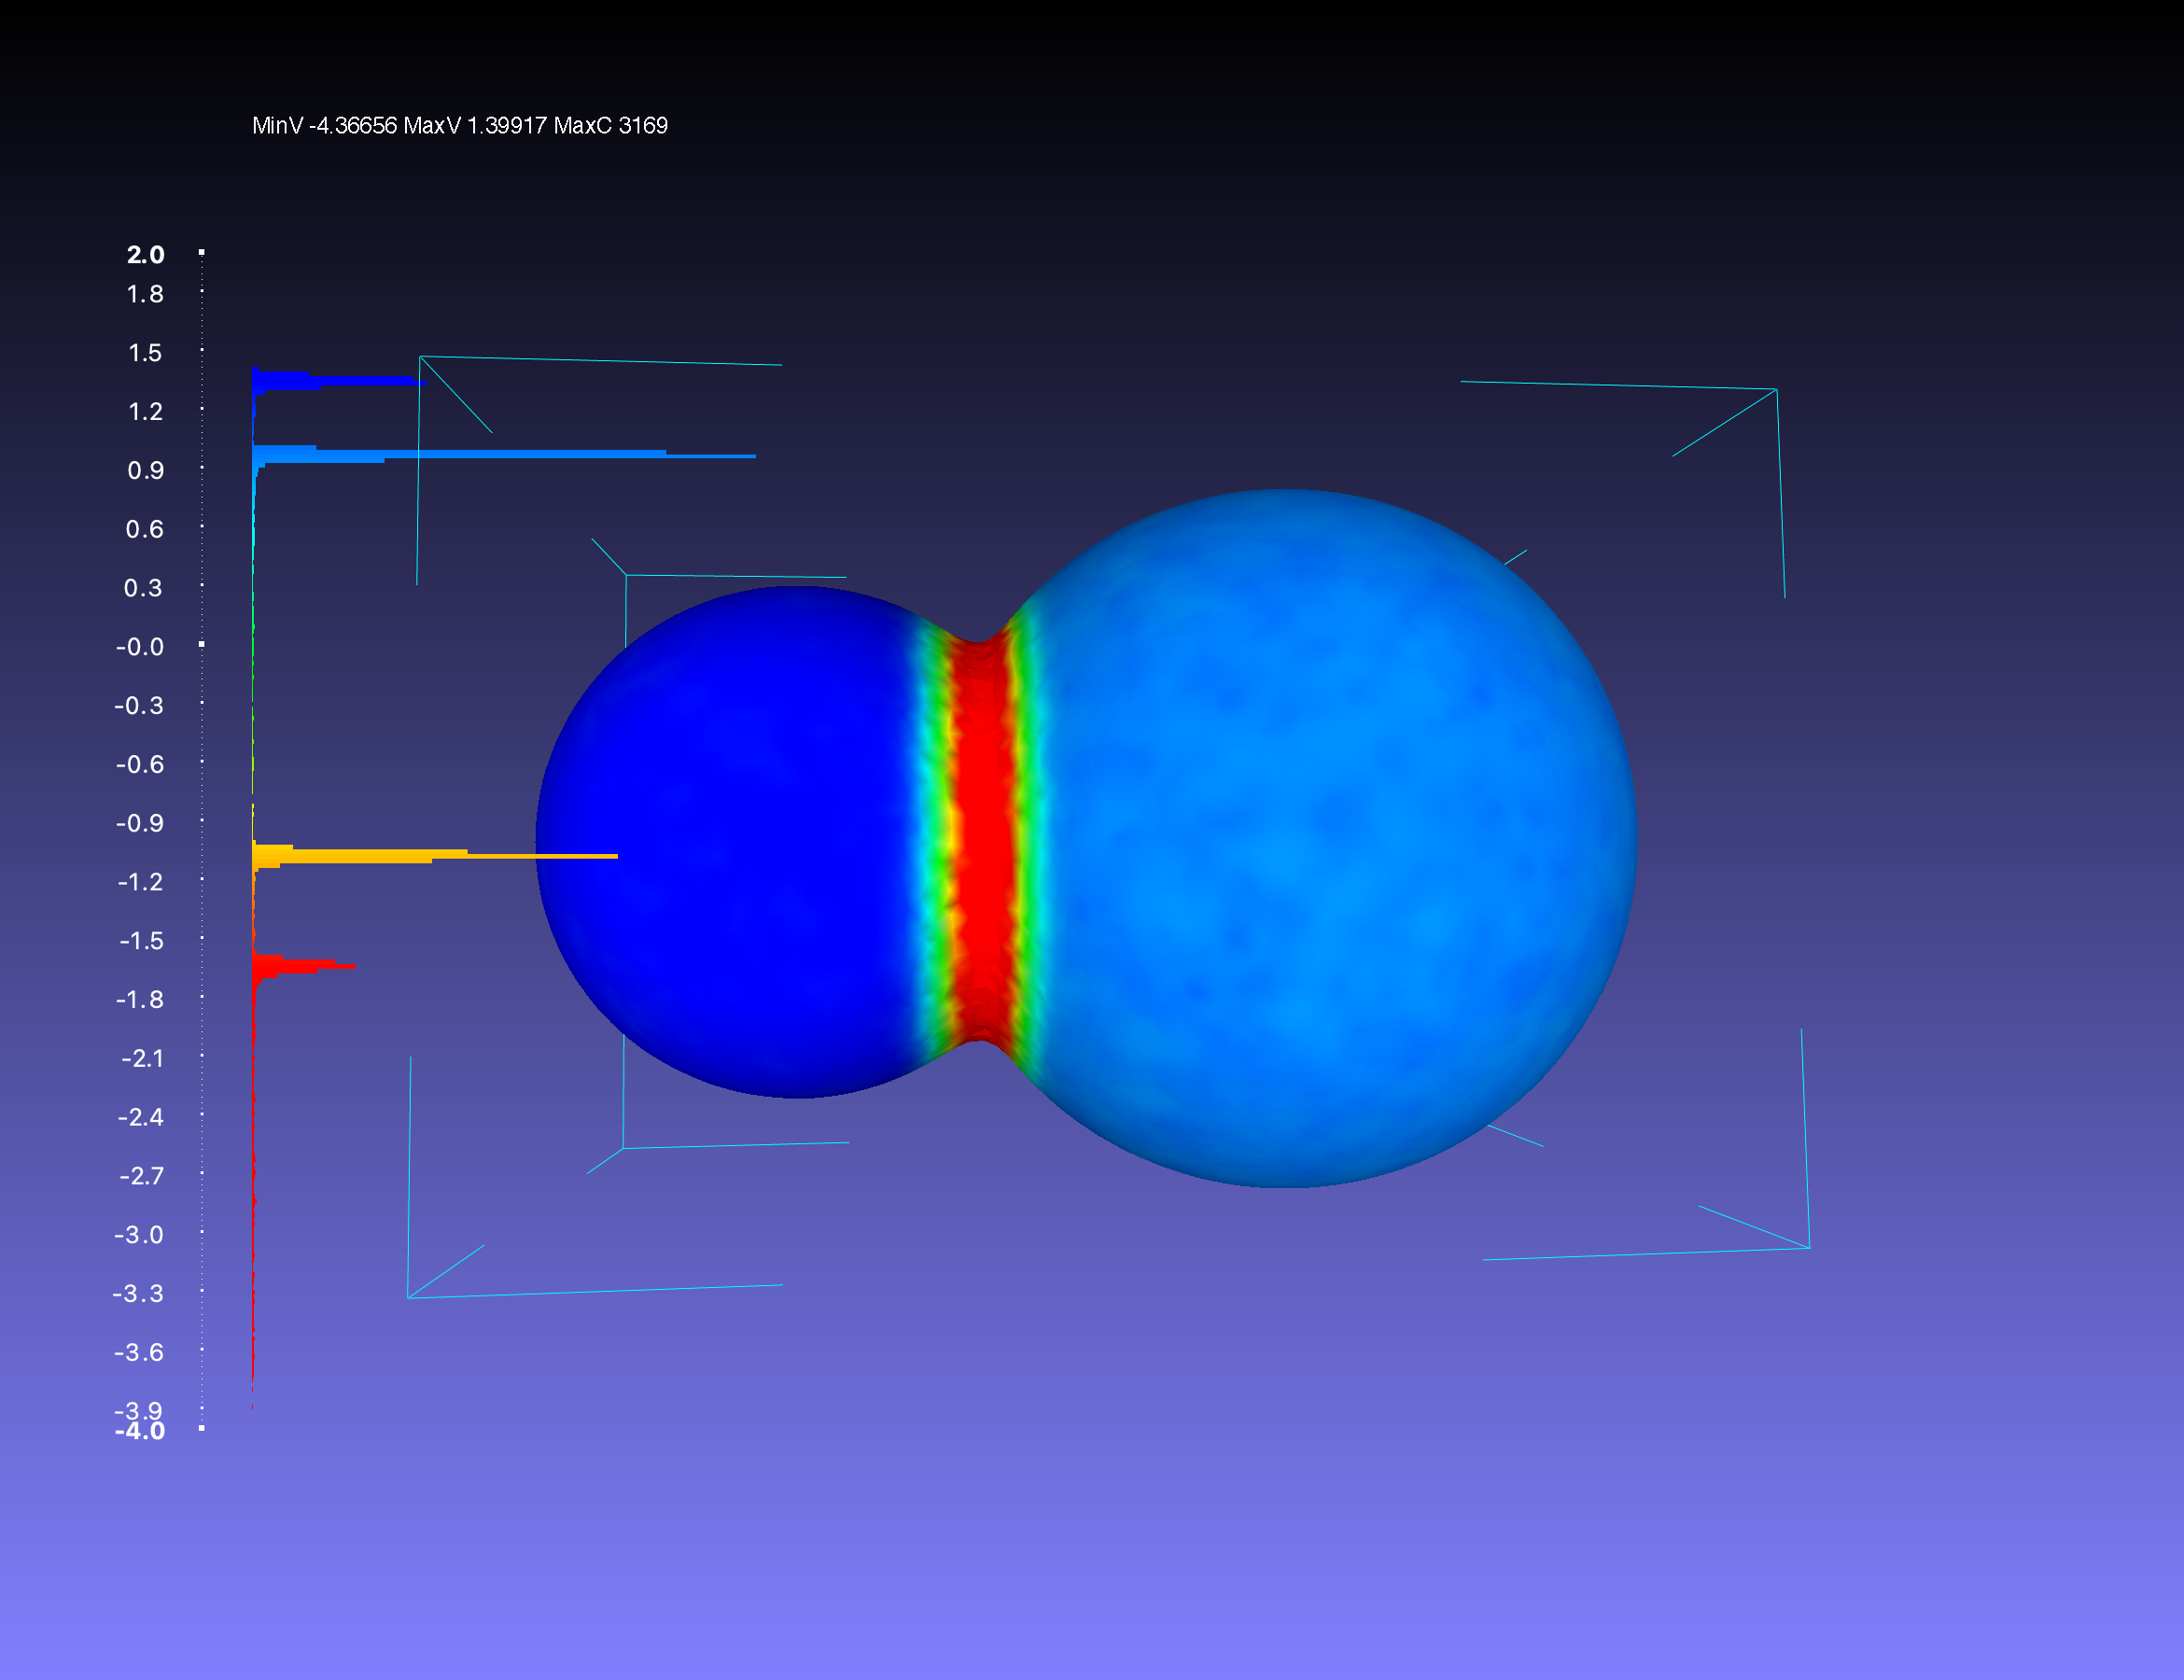
for my work I am currently trying compare the mean curvature of different meshes. I have the following scheme. I have a ground truth mesh and a comparison mesh, which I want to compare it too. I am using meshlab to do it.
1.) Compute the curvature of the comparison mesh (as a vertex attribute)
2.) Transfer the vertex attribute to the original mesh
3.) Save the vertex attribute of the original in an array e.g. vertex_attribute_comparison and compute the curvature of the original (also save as vertex attribute)
4.) Extract this vertex attribute into another array e.g. vertex_attribute_original
5.) Apply the formula (vertex_attribute_comparison-vertex_attribute_original)*r0, where $r_0$ is a normalization radius $r_0 = \sqrt{\frac{A}{4 \pi}},$ where $A$ is the total area of the original mesh.
6.) Transfer the difference as a vertex attribute back to the original mesh.
In theory this should give you a reasonable account for the difference in curvature. Except the difference is huge. Behold the following as an example I tried compare the curvature of a dumbbell.
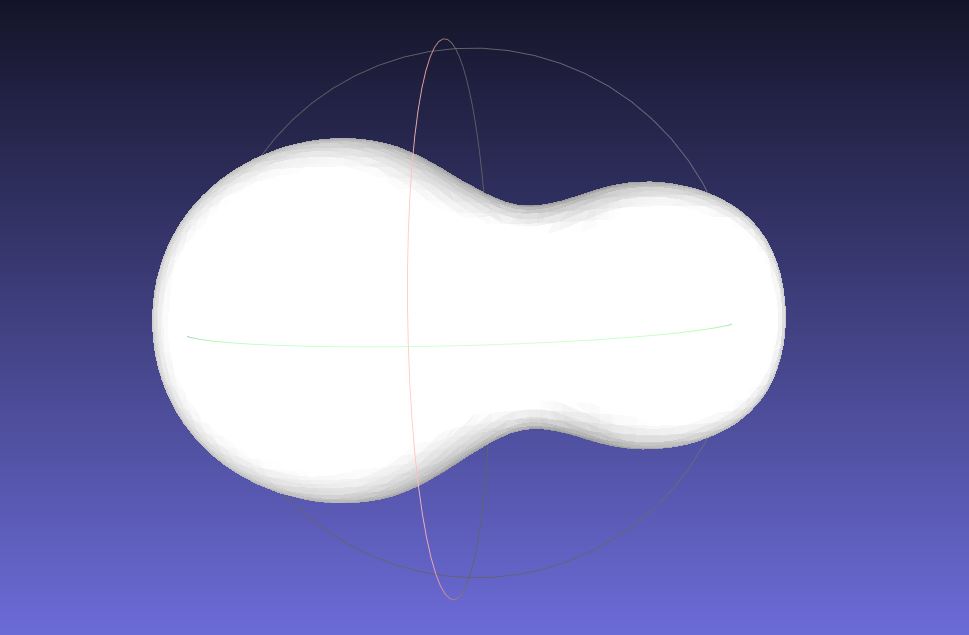
The Mesh to be compared with looks like this:
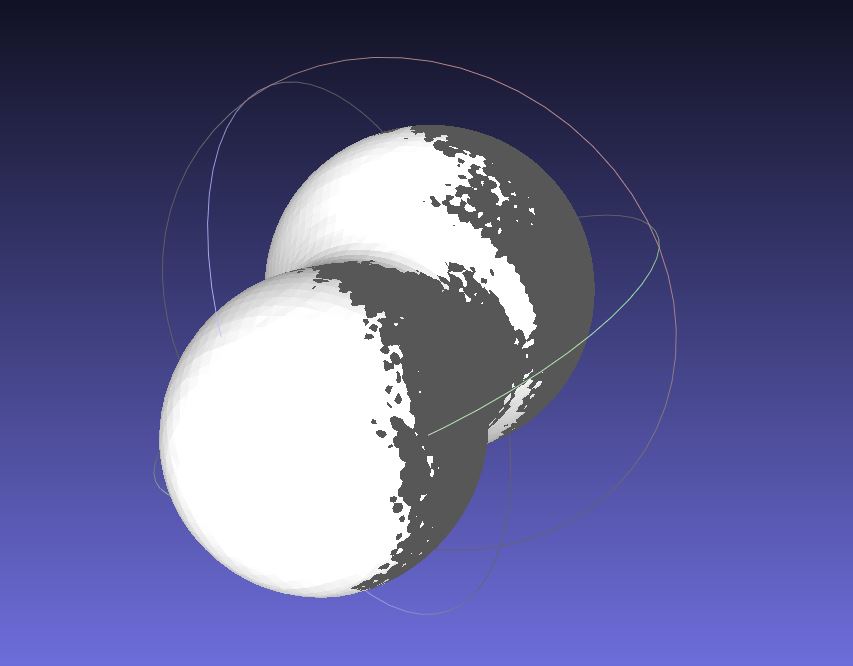
When laying both on top of one another, we can see this:
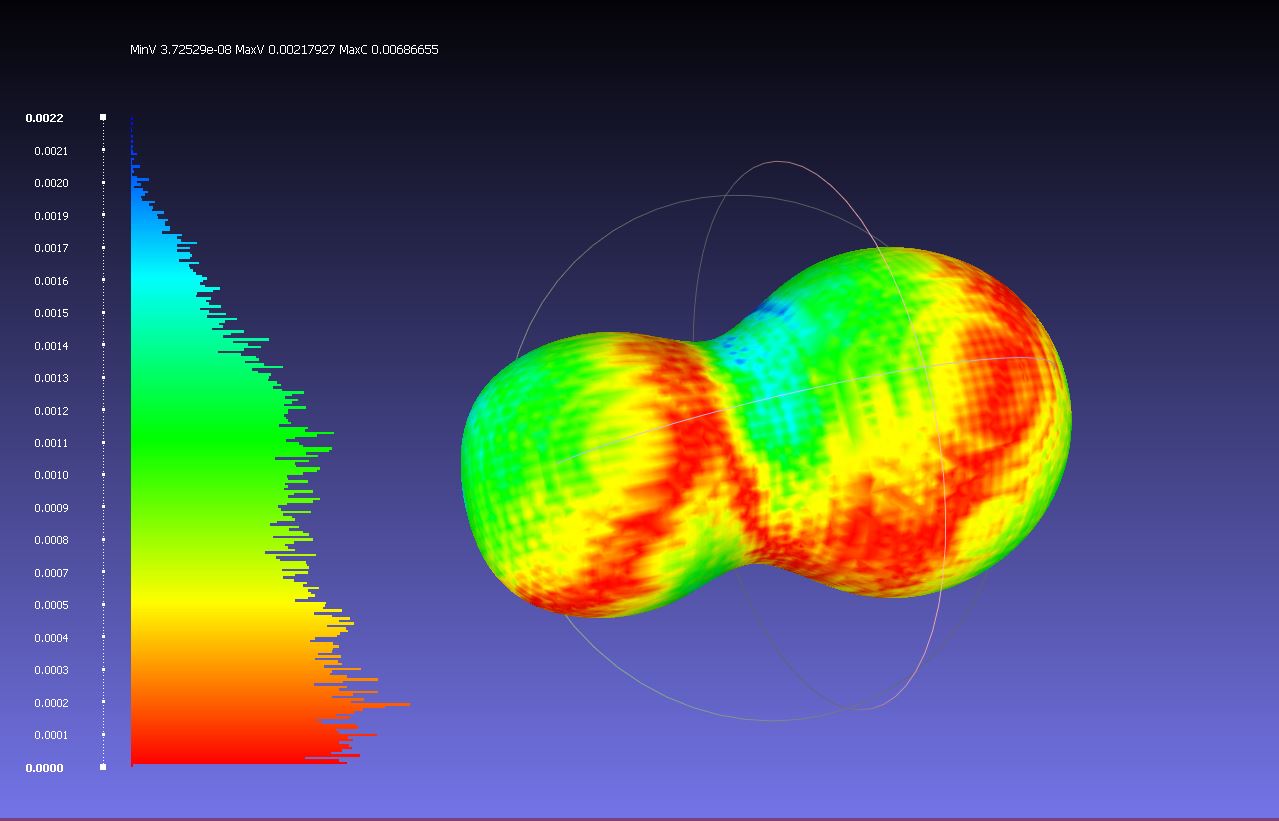
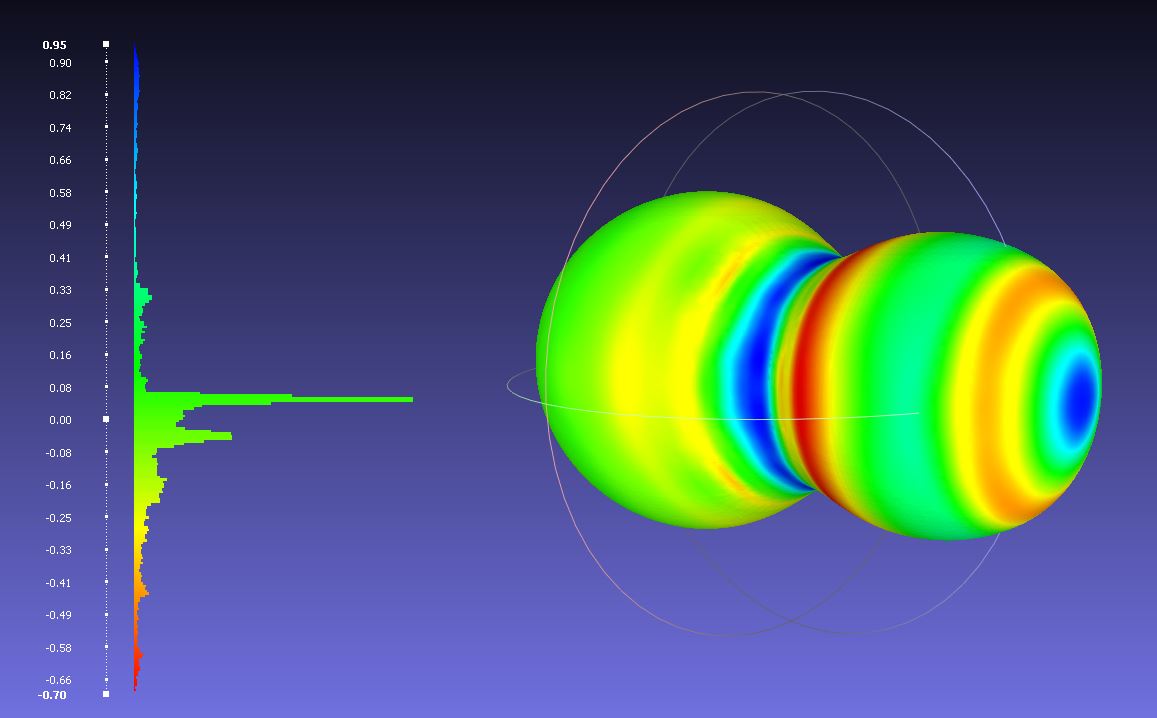
We see that the dumbbells are really almost exactly the same. When comparing there Hausdorff distance, we find the following Histogram:
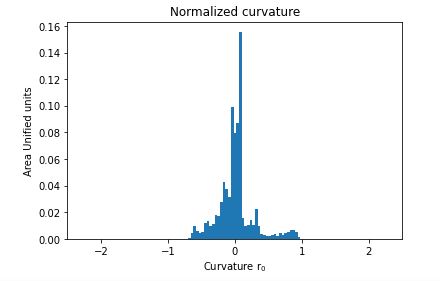
note that the maximum value for the Hausdorff distance is 0.0022. To put this number into perspective : The length of the dumbbells is $0.72$ and their radius is $0.41$ They are almost the same meshes, yet when I do the above described curvature comparison, I get the following area weighted histogram:
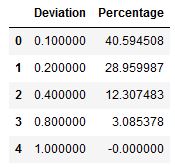
One can see that the deviation goes almost until $r_0$, which I find quite strong. I tried to categorize the deviations in a table as follows:
and found:
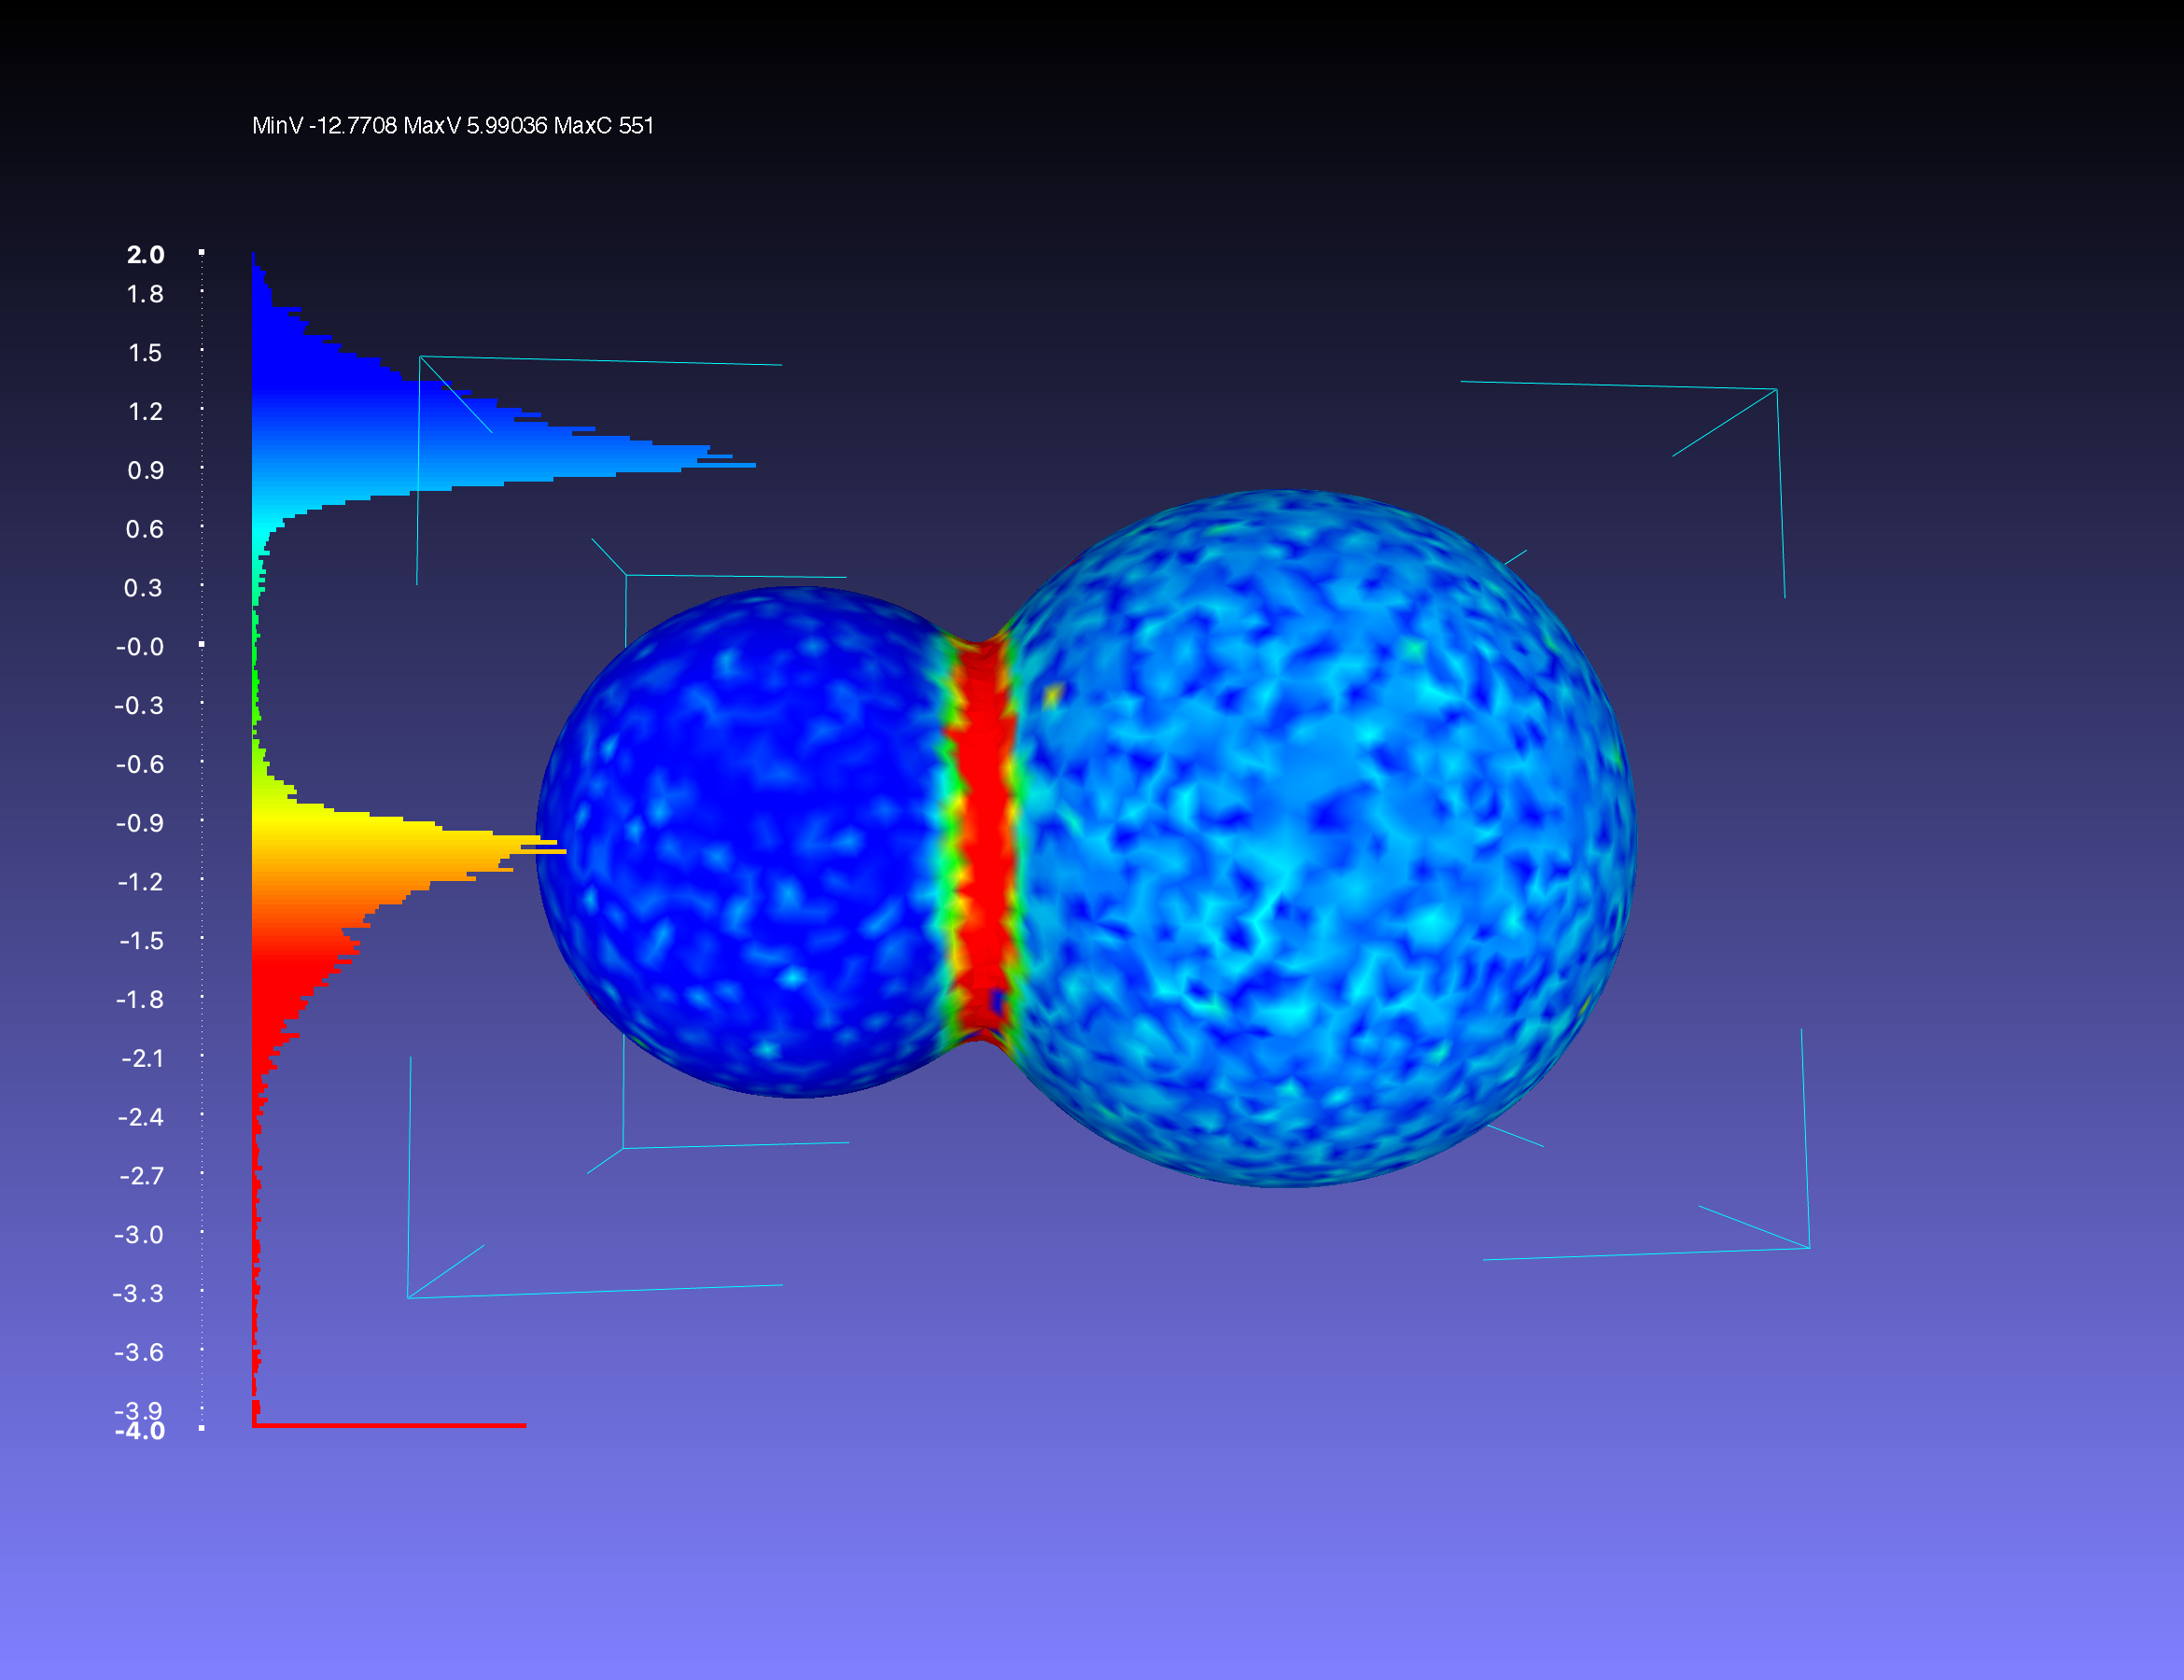
Table of deviations, Left column: Deviation, Right column: part of the area where the deviation is larger than the given value in $r_0,$ We can plot the deviations on the mesh itself, which looks like this:
Now my question is: Why is the curvature difference so unreasonably large. As an algorithm I used the APSS curvature as implemented in meshlab. The paper in which the algorithm was introduced can be found here:
https://www.labri.fr/perso/guenneba/docs/APSS_sig07.pdf
As an MLS filter scale I used after some trying 20 (this was where I found the smallest deviation.) I also tried to use discrete curvature as implemented in meshlab, but the deviations there where even worse. Does anybody know, why it is showing this behavior?
Any help would be highly appreciated
