I've just started messing around with FEniCS. I am solving Poisson with 3rd order elements and would like to visualize the results. However, when I use plot(u), the visualization is just a linear interpolation of the results. I get the same thing when I output to VTK. In another code I am working with, I wrote a VTK outputter that would upsample higher order elements so that they actually looked higher order in Paraview. Is there anything like this (or better) in FEniCS?
2 Answers
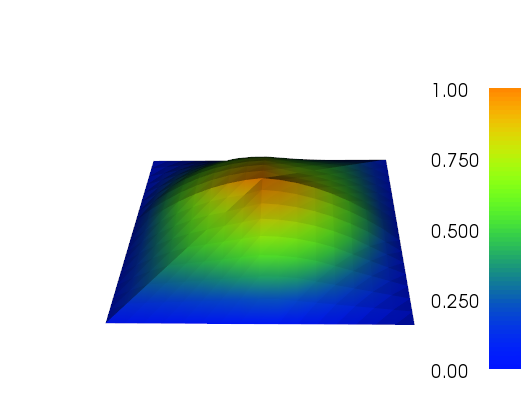
You can interpolate the solution onto a finer mesh and then plot it:
from dolfin import *

coarse_mesh = UnitSquareMesh(2, 2)
fine_mesh = refine(refine(refine(coarse_mesh)))

P2_coarse = FunctionSpace(coarse_mesh, "CG", 2)
P1_fine = FunctionSpace(fine_mesh, "CG", 1)

f = interpolate(Expression("sin(pi*x[0])*sin(pi*x[1])"), P2_coarse)
g = interpolate(f, P1_fine)

plot(f, title="Bad plot")
plot(g, title="Good plot")

interactive()
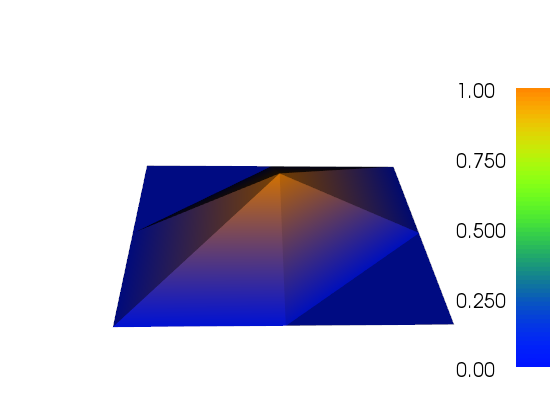
Notice how you can see the outline of the coarse P2 triangles in the plot on the finer mesh.
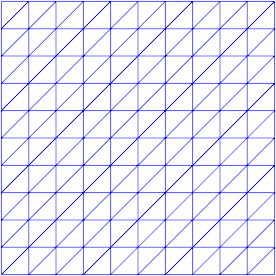
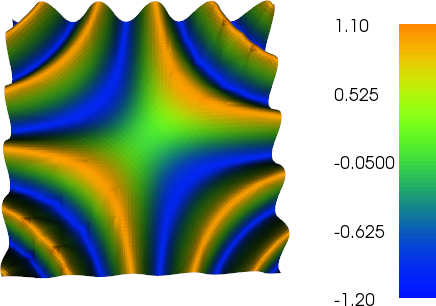
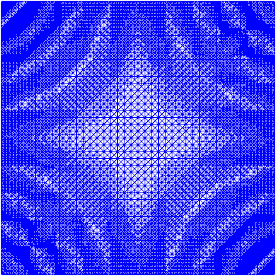
I've been working a bit on adaptive refinement to do the job (see the code below). The scaling of the error indicator with total mesh size and total variation of the mesh function is not perfect, but you could fit that to your needs. The images below are for testcase #4. The number of cells increases from 200 to about 24,000, which may be a bit over the top, but the result is quite nice. The mesh shows that only the relevant portions have been refined. The artefacts you can still see, are what the third order elements themselves couldn't represent sufficiently accurate.
from dolfin import *
from numpy import abs


def compute_error(expr, mesh):
    DG = FunctionSpace(mesh, "DG", 0)
    e = project(expr, DG)
    err = abs(e.vector().array())
    dofmap = DG.dofmap()
    return err, dofmap


def refine_by_bool_array(mesh, to_mark, dofmap):
    cell_markers = CellFunction("bool", mesh)
    cell_markers.set_all(False)
    n = 0
    for cell in cells(mesh):
        index = dofmap.cell_dofs(cell.index())[0]
        if to_mark[index]:
            cell_markers[cell] = True
            n += 1
    mesh = refine(mesh, cell_markers)
    return mesh, n


def adapt_mesh(f, mesh, max_err=0.001, exp=0):
    V = FunctionSpace(mesh, "CG", 1)
    while True:
        fi = interpolate(f, V)
        v = CellVolume(mesh)
        expr = v**exp * abs(f-fi)
        err, dofmap = compute_error(expr, mesh)

        to_mark = (err>max_err)
        mesh, n = refine_by_bool_array(mesh, to_mark, dofmap)
        if not n:
            break

        V = FunctionSpace(mesh, "CG", 1)
    return fi, mesh


def show_testcase(i, p, N, fac, title1="", title2=""):
    funcs = ["sin(60*(x[0]-0.5)*(x[1]-0.5))",
             "sin(10*(x[0]-0.5)*(x[1]-0.5))",
             "sin(10*(x[0]-0.5))*sin(pow(3*(x[1]-0.05),2))"]

    mesh = UnitSquareMesh(N, N)
    U = FunctionSpace(mesh, "CG", p)
    f = interpolate(Expression(funcs[i]), U)

    v0 = (1.0/N) ** 2;
    exp = 1
    #exp = 0
    fac2 = (v0/100)**exp
    max_err = fac * fac2
    #print v0, fac, exp, fac2, max_err
    g, mesh2 = adapt_mesh(f, mesh, max_err=max_err, exp=exp)

    plot(mesh, title=title1 + " (mesh)")
    plot(f, title=title1)
    plot(mesh2, title=title2 + " (mesh)")
    plot(g, title=title2)
    interactive()


if __name__ == "__main__":
    N = 10
    fac = 0.01
    show_testcase(0, 1, 10, fac, "degree 1 - orig", "degree 1 - refined (no change)")
    show_testcase(0, 2, 10, fac, "degree 2 - orig", "degree 2 - refined")
    show_testcase(0, 3, 10, fac, "degree 3 - orig", "degree 3 - refined")
    show_testcase(0, 3, 10, 0.2*fac, "degree 3 - orig", "degree 3 - more refined")
    show_testcase(1, 2, 10, fac, "smooth: degree 2 - orig", "smooth: degree 2 - refined")
    show_testcase(1, 3, 10, fac, "smooth: degree 3 - orig", "smooth: degree 3 - refined")
    show_testcase(2, 2, 10, fac, "bumps: degree 2 - orig", "bumps: degree 2 - refined")
    show_testcase(2, 3, 10, fac, "bumps: degree 3 - orig", "bumps: degree 3 - refined")

