0
$\begingroup$

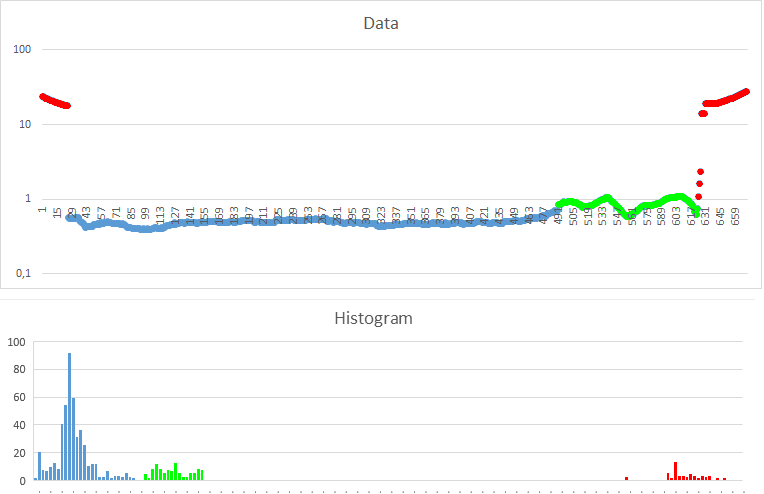
I have this data, and I need to detect the outliers.

The outliers are clearly visible on the borders (start and end, in red). And I only care for outliers present at the start or end.

Screen capture

I could easily make a rule as "all values over 10 are outliers", but I do not have any assurance that the distance will always be over 10.

I could also say "a big distance between points means an outlier", but again, it is arbitrary to say what is a "big distance".

Also, part of the licit data has (in green) some outliers characteristics, compared to the mainstream data (in blue).

I had been checking some algorithms for detection of outliers, but they always assume something wrong, like a gaussian distribution, or just declaring "outliers" to all quartiles over 75%.

Is there any more general criteria for detection of outliers?
$\endgroup$
4
  • $\begingroup$ If you know/can assume that your data can be split into populations (as it seems the case here) maybe you can use some sort of cluster algorithm (like k-means or something similar). $\endgroup$
    – lr1985
    Commented May 8, 2018 at 18:21
  • $\begingroup$ @lr1985 I tried k-means. It is simple to implement and works. Thank you. Have a reward youtube.com/watch?v=XOp29cYbiaQ $\endgroup$
    – yoxota
    Commented May 10, 2018 at 12:08
  • $\begingroup$ Actually, I cannot assume that the data is always split into different populations. Outliers may (rarely) not be present, but k-means will always find two populations. $\endgroup$
    – yoxota
    Commented May 10, 2018 at 13:41
  • $\begingroup$ well, with k-means algorithm you usually set the number of clusters beforehand. If you can't assume to always have outliers I'm afraid you'll need some sort of mixed method where you first try to understand whether you have outliers and then use k-means to actually detect them. It's really hard to come up with a reliable method without having representative datasets to test it on. $\endgroup$
    – lr1985
    Commented May 10, 2018 at 15:45

1 Answer 1

1
$\begingroup$

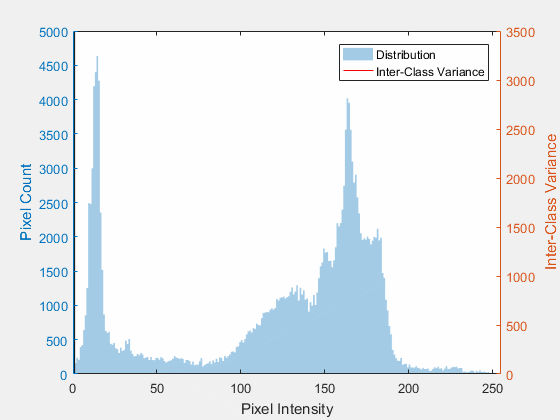
If the histogram you're displaying is representative than you could methods which are used for binarization in Image Processing.

For instance, using Otsu's Method will probably be a robust way to set the threshold you're after.

enter image description here

$\endgroup$

Your Answer

By clicking “Post Your Answer”, you agree to our terms of service and acknowledge you have read our privacy policy.

Not the answer you're looking for? Browse other questions tagged or ask your own question.