3
$\begingroup$

Let's assume, that we have damped harmonic oscillation of a body in the form of a cone, immersed in a liquid. the cone, immersed in a liquid
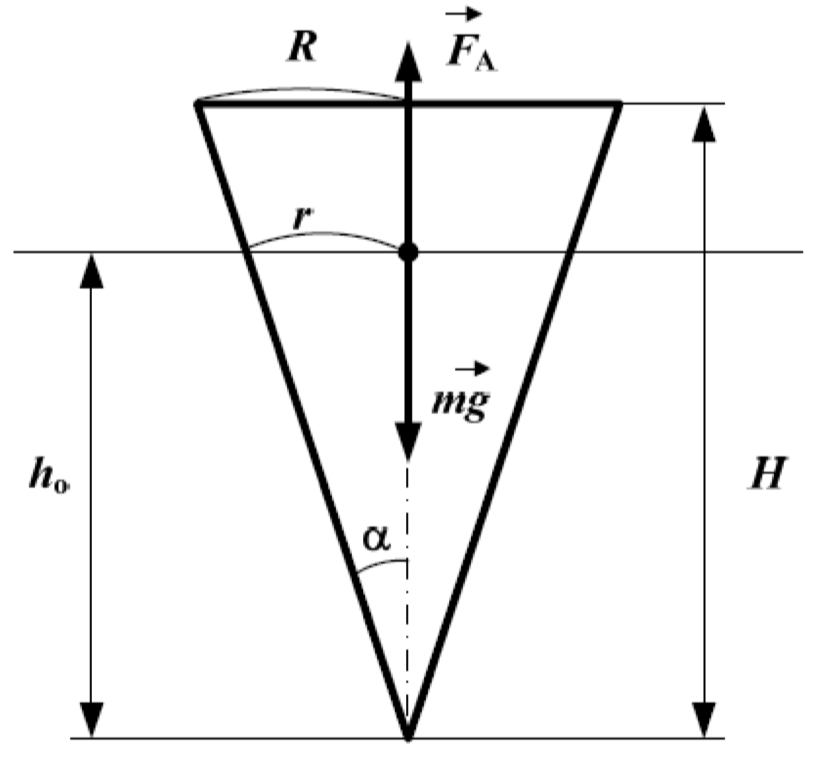
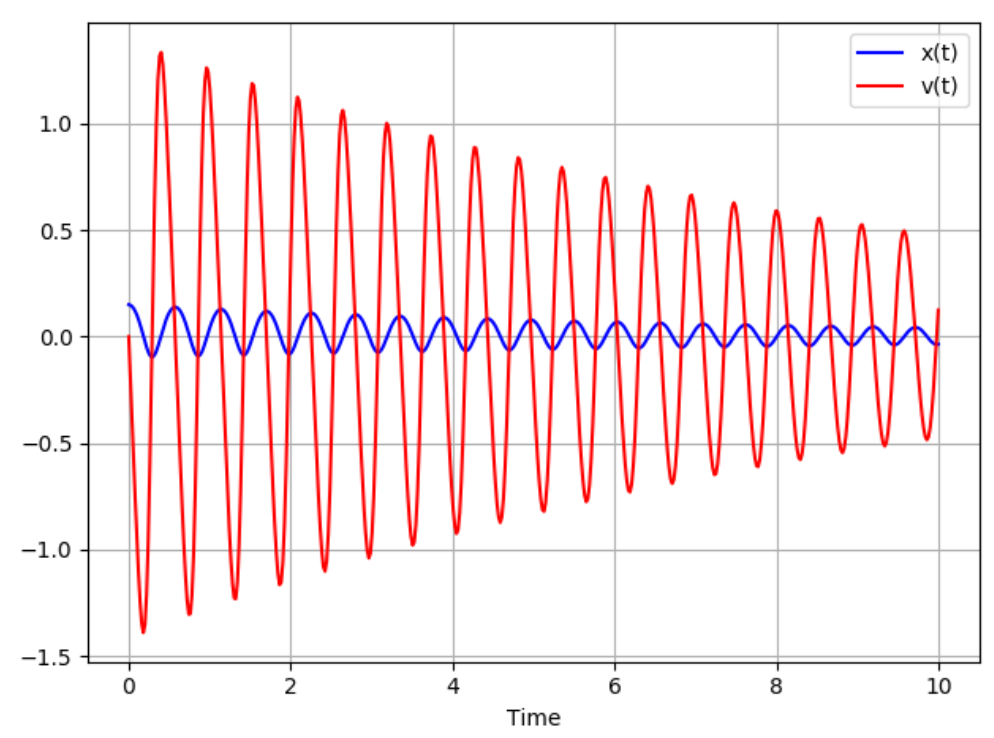
Equilibrium condition of the body is: $$m\overrightarrow{a} = \overrightarrow{F_\text{res}} + m\overrightarrow{g} + \overrightarrow{F_{a}}$$ We can describe oscillations with the following differential equation. $$\frac{ d^{2}x }{dt^{2}} = -g + \frac{ \pi tg^{2} \alpha ( h_{0}-x)^{2}}{m} \left( \frac{\rho_\text{liquid}g}{3} (h_{0}-x) - \frac{f}{\sin \alpha} \frac{dx}{dt}\right)$$ Here is a chart which shows the dependence of displacement and speed from time (i.e. damped oscillation) enter image description here My goal is to change the density of the fluid ($\rho_\text{liquid}$) and the resistance coefficient($f$), find their values, starting from which the oscillations stop (i.e. the amplitude reach some small threshold value) after a specified time (e.g. $t=6$). At the current moment I solved this task in a very ineficient way with pyhton code:
    def dec_range(start, end, step):
         while start <= end:
         yield start
         start += step

    for f_v in dec_range(15, 100.0, 0.05):
        vt, vx, vv = oiler(f = f_v)

        index = 0
        for i, time in enumerate(vt):
            if abs(vt[index] - t) > abs(vt[i] - t):
                index = i

        max_before=max(map(abs, vx[index-15:index]))
        max_after=max(map(abs, vx[index:index+15]))

        vx_in_point = vx[index]
        vv_in_point = vv[index]

        if (abs(max_before - vx_in_point) > epsilon) and (abs(max_after - vx_in_point) < epsilon) and (abs(vv_in_point) < epsilon_for_v) :
            with open(FILE_NAME, 'w') as f:
                for t, x, v in list(zip(vt, vx, vv)):
                    f.write("%0.10f %0.20f %0.20f\n" % (t, x, v))
            print('koefficient = ', f_v)
            break

I use the iterative algorithm and change resistance coefficient ($f$) with a small step and use the Euler method to solve DE on every iteration. What I am trying to achieve is to find an efficient algorithm and find both: $\rho_\text{liquid}$ and $f$

$\endgroup$
5
  • 2
    $\begingroup$ $"starting from which the oscillations stop after a specified time (e.g. t=6)"* The oscillations 'never' stop: the decay is exponential. Where did you get the EoM from and how did you solve it? $\endgroup$
    – Gert
    Commented May 11, 2019 at 15:02
  • $\begingroup$ Andrii, you need to specify a time constant for this process, which is the amount of time that it takes for the amplitude to decay to 37% of its starting value. $\endgroup$
    – David White
    Commented May 11, 2019 at 19:59
  • $\begingroup$ Gert, I updated my post. In EoM I meant that the amplitude of the oscillation reaches some small threshold value epsilon (e.g. epsilon = 0.001) $\endgroup$ Commented May 11, 2019 at 20:25
  • $\begingroup$ David White, I have this time constant $t$. But it is unclear why you specify 37%. How did you get this value? $\endgroup$ Commented May 11, 2019 at 20:35
  • $\begingroup$ Your code does not work. $\endgroup$
    – nicoguaro
    Commented May 16, 2019 at 14:06

2 Answers 2

1
$\begingroup$

If I understand your problem correctly, you just need to do parameter identification from a known model and non-noisy data. The standard way to do this is via a nonlinear least-squares framework. To do this, after solving the ODE for your given choice of $\rho$ and $f$ at some number of time points, you create a cost function that is a function of $\rho$ and $f$ of the form

$$\text{cost}(\rho,f) = \sum(\text{model}(\rho,f)-\text{data}).$$

This along with an initial guess for $\rho$ and $f$ can be put into an NLS solver, like scipy.optimize.least_squares to determine the desired parameters. Furthermore, there are also some statistics for these estimates that you can estimate; see here.

$\endgroup$
0
$\begingroup$

It might be worth a try, to write the max amplitudes of the oscillation to file while you run it. If it is almost decayed, you may stop the simulation.

Use the exported file to fit a function:

$$f(t) = a + b e^{-td}$$

If you have enough datapoints and relatively clean peaks, your amplitude from the fit should be quite good. You may even get good error bars from your fitting function of choice. You cannot simulate till eternity anyway.

$\endgroup$

Your Answer

By clicking “Post Your Answer”, you agree to our terms of service and acknowledge you have read our privacy policy.

Not the answer you're looking for? Browse other questions tagged or ask your own question.