5
$\begingroup$

I have coded a routine for interpolation with B-splines, only to discover later that this functionality is already included in Python's SciPy.

However, I do not understand one parameter in the SciPy module (UnivariateSpline)[http://docs.scipy.org/doc/scipy/reference/generated/scipy.interpolate.UnivariateSpline.html#scipy.interpolate.UnivariateSpline]. The parameter I do not understand is parameter s, which is a

Positive smoothing factor used to choose the number of knots. If None (default), s=len(w) (w is the array of weights). If s=0, spline will interpolate through all data points.

Below I have included two plots , that interpolate the potential energy curve of the $H^+_2$ molecule, top plot for s=None, bottom plot for s=0. I would have expected it the other way around. This is probably due to my understanding of knots in B-splines. Can anybody explain to me, how the knots are implemented in SciPy's Univariate routine (in a nutshell, I can go through the source myself, but this is not the point).
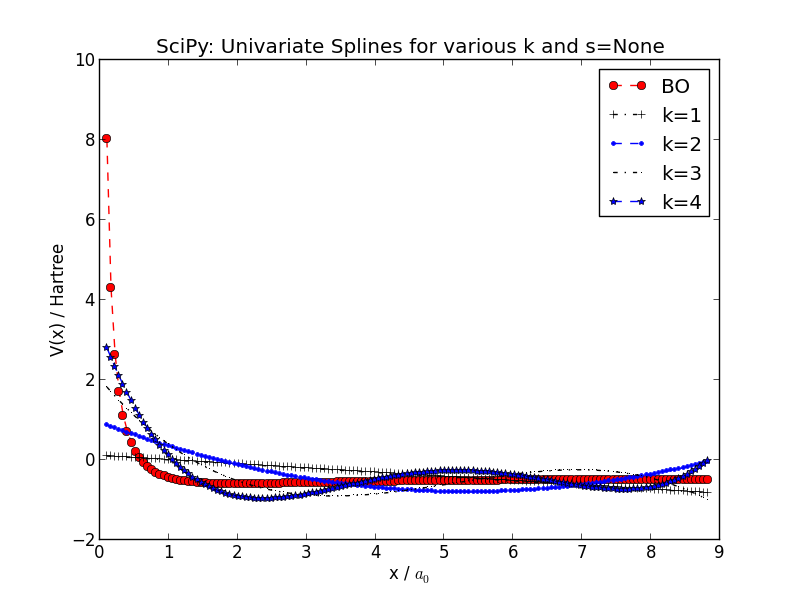
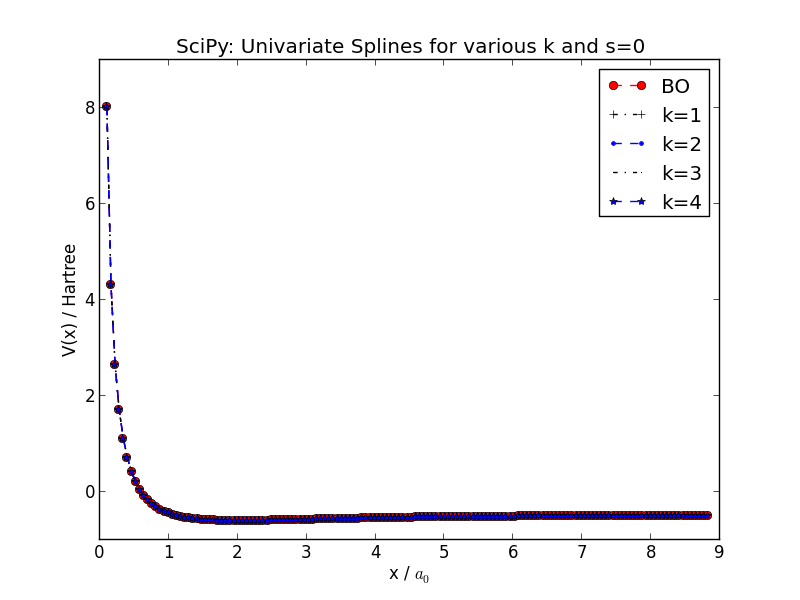
enter image description here

enter image description here

This is the code, you need to download this data file and name it *BO_energy.txt" in order to run it:

import matplotlib.pyplot as plt
import numpy as np
from scipy.interpolate import UnivariateSpline

krange=[1,5]
data = np.genfromtxt("BO_energy.txt")
x = data[:,0]
V = data[:,1]
mk = [ "-.ks", "k-.+", "b--.", "k-.,", "b--*", "k--", "ro", "ro"]

#plot for s = None
plt.figure(1)
plt.plot(x, V, 'r--o', label="BO")
for i in range(krange[0],krange[1]):
    spline = UnivariateSpline(x,V,k=i)
    plt.plot(x,spline(x),mk[i], label="k=%d"%i)
plt.legend()
plt.title("SciPy: Univariate Splines for various k and s=None")
plt.xlabel("x / $a_0$")
plt.ylabel("V(x) / Hartree")
plt.savefig("../01.png")

#plot for s = 0
plt.figure(2)
plt.plot(x, V, 'r--o', label="BO")
for i in range(krange[0],krange[1]):
    spline = UnivariateSpline(x,V,k=i,s=0)
    plt.plot(x,spline(x),mk[i], label="k=%d"%i)
plt.legend()
plt.title("SciPy: Univariate Splines for various k and s=0")
plt.xlabel("x / $a_0$")
plt.ylabel("V(x) / Hartree")
plt.savefig("../02.png")

plt.show()
$\endgroup$

2 Answers 2

3
$\begingroup$

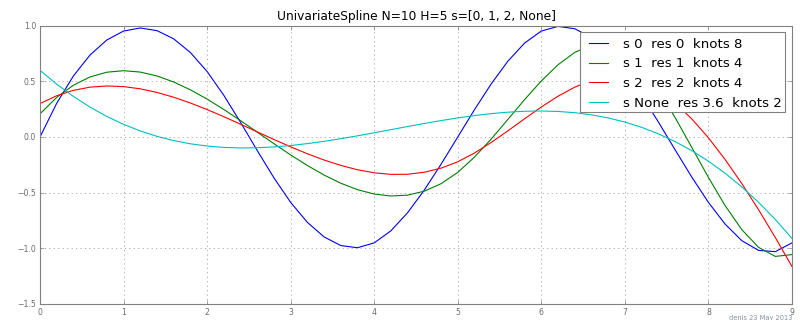
s sets a target residual value; s=0 interpolates the data. Use get_residual() to look at the s achieved, and get_knots() to look at the knots, as in the little test below. You see that s=0 has about N = len(x) knots, and increasing s => fewer knots (polynomial pieces).

s is the sum of residuals^2, |y - yinterpolated|^2, at the input data points; this scales with y and N, making it difficult to use. To set a target rmserror like 1 % of max |y|, set s like this:

s = N * (rmserror * np.fabs(y).max())**2
UnivariateSpline( x, y, s=s )

s=None uses a not-very-useful value.

enter image description here

""" scipy UnivariateSpline sensitivity to smoothing parameter s
    interpolate N -> N*H points with various s
"""
# 2013-01-27 Jan denis

from __future__ import division
import sys
import numpy as np
from scipy.interpolate import UnivariateSpline  # $scipy/interpolate/fitpack2.py
    # http://docs.scipy.org/doc/scipy/reference/tutorial/interpolate.html
    # InterpolatedUnivariateSpline : Subclass with smoothing forced to 0

#...............................................................................
N = 10
H = 5  # xfine ~ N * H
freq = .2
noise = 0
s = [0, 1, 2, None]  # smoothing parameter, scales with y; s=0 interpolates
plot = 0
seed = 0

exec( "\n".join( sys.argv[1:] ))  # run this.py N= ...  from sh or ipython
np.set_printoptions( 1, threshold=100, edgeitems=5, suppress=True )
np.random.seed(seed)
if plot:
    import pylab as pl
    pl.figure( figsize=[10,4] )

#...............................................................................
x = np.arange( N )
y = np.sin( 2*np.pi * freq * x )  # <-- your function here
xfine = np.arange( (N - 1) * H + 1. ) / H  # |...|...|...|
if noise > 0:
    y += np.random.normal( 0, noise, y.shape )

#...............................................................................
title = "UnivariateSpline N=%d H=%d s=%s" % (N, H, s)
print 80 * "-"
print title
for s in s:
    uspline = UnivariateSpline( x, y, s=s )  # s=0 interpolates
    yfine = uspline( xfine )  # y interpolated n a fine grid

    res = uspline.get_residual()
    sumres2 = np.sum( (y - yfine[::H]) ** 2 )  # == res == s
    rms = np.sqrt( sumres2 / N )
    knots = uspline.get_knots()
    label = "s %s  res %.2g  rms %.1g  knots %d " % (s, res, rms, len(knots))
    knots = uspline.get_knots()
    label = "s %s  res %.2g  knots %d " % (s, res, len(knots))
    print label, knots
    print ""
    if plot:
        pl.plot( xfine, yfine, label=label )

if plot:
    pl.title(title)
    pl.legend()
    pl.savefig( "tmp.png" )
    pl.show()
$\endgroup$
4
$\begingroup$

The B-Spline routines in SciPy are wrappers around the spline package by Paul Dierckx (FORTRAN implementation here), although the docs say FITPACK in the first line (which is in fact another package) but then refer to routines from Dierckx.

When given a task to find a spline fit to a set of data, you have the choice of giving the routine the knots or by asking the routine to find an 'optimal' placement of the knots. In the latter case, the smoothing parameter will help the routine to choose the placement as it allows you to indicate what you find important: interpolation (and possibly an oscillating curve) or a smooth curve (but with possibly larger residuals to your data).

A good introduction on splines and approximation using splines is a book by the author of the original FORTRAN code: "Curve and surface fitting with splines", P. Dierckx, 1995, Oxford University Press.

$\endgroup$
2
  • 2
    $\begingroup$ Name clash: apparently, Dierckx named his package "FITPACK" as well (see readme). To avoid confusion, netlib maintainers named it "dierckx". $\endgroup$
    – GertVdE
    Commented Apr 25, 2013 at 12:29
  • $\begingroup$ thanks for the explanation. this naming issue, i.e. FITPACK, is really confusing, indeed. $\endgroup$
    – seb
    Commented Apr 25, 2013 at 12:59

Your Answer

By clicking “Post Your Answer”, you agree to our terms of service and acknowledge you have read our privacy policy.

Not the answer you're looking for? Browse other questions tagged or ask your own question.