I have coded a routine for interpolation with B-splines, only to discover later that this functionality is already included in Python's SciPy.
However, I do not understand one parameter in the SciPy module (UnivariateSpline)[http://docs.scipy.org/doc/scipy/reference/generated/scipy.interpolate.UnivariateSpline.html#scipy.interpolate.UnivariateSpline]. The parameter I do not understand is parameter s, which is a
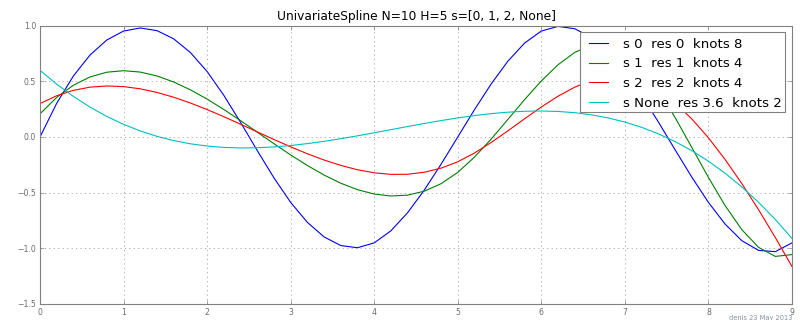
Positive smoothing factor used to choose the number of knots. If None (default), s=len(w) (w is the array of weights). If s=0, spline will interpolate through all data points.
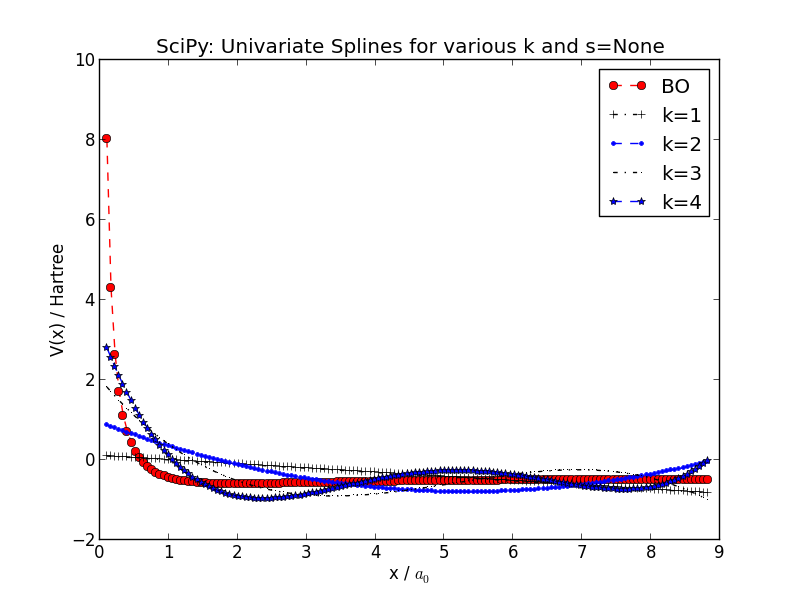
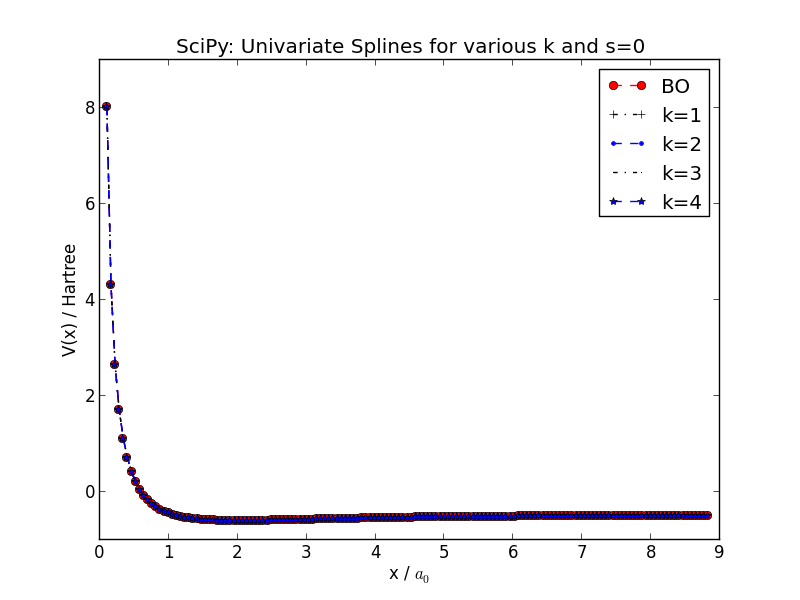
Below I have included two plots , that interpolate the potential energy curve of the $H^+_2$ molecule, top plot for s=None, bottom plot for s=0. I would have expected it the other way around. This is probably due to my understanding of knots in B-splines. Can anybody explain to me, how the knots are implemented in SciPy's Univariate routine (in a nutshell, I can go through the source myself, but this is not the point).


This is the code, you need to download this data file and name it *BO_energy.txt" in order to run it:
import matplotlib.pyplot as plt
import numpy as np
from scipy.interpolate import UnivariateSpline

krange=[1,5]
data = np.genfromtxt("BO_energy.txt")
x = data[:,0]
V = data[:,1]
mk = [ "-.ks", "k-.+", "b--.", "k-.,", "b--*", "k--", "ro", "ro"]

#plot for s = None
plt.figure(1)
plt.plot(x, V, 'r--o', label="BO")
for i in range(krange[0],krange[1]):
    spline = UnivariateSpline(x,V,k=i)
    plt.plot(x,spline(x),mk[i], label="k=%d"%i)
plt.legend()
plt.title("SciPy: Univariate Splines for various k and s=None")
plt.xlabel("x / $a_0$")
plt.ylabel("V(x) / Hartree")
plt.savefig("../01.png")

#plot for s = 0
plt.figure(2)
plt.plot(x, V, 'r--o', label="BO")
for i in range(krange[0],krange[1]):
    spline = UnivariateSpline(x,V,k=i,s=0)
    plt.plot(x,spline(x),mk[i], label="k=%d"%i)
plt.legend()
plt.title("SciPy: Univariate Splines for various k and s=0")
plt.xlabel("x / $a_0$")
plt.ylabel("V(x) / Hartree")
plt.savefig("../02.png")

plt.show()
