Which software provides a good workflow from simple plotting of a few datapoints up to the creation of publication level graphics with detailed styles, mathematical typesetting and "professional quality"?
This is a bit related to the question of David (What attributes make a figure professional quality?) but the focus is not on the attributes but on the software or general the workflow to get there. I have superficial experience with a number of programs, Gnuplot, Origin, Matplotlib, TikZ/PGFplot, Qtiplot but doing data analysis and nice figures at the same time seems rather hard to do.
Is there some software that allows this or should I just dig deeper in one of the packages?
Edit: My current workflow is a mix of different components, which more or less work together but in total it is not really efficient and I think this is typical for a number of scientists at an university lab. Typically it is a chain starting from the experiment to the publication like this:
- Get experimental data (usually in ASCII form, but with different layout, e.g. headers, comments, number of columns)
- Quick plot of the data to check whether nothing went wrong in Origin, Gnuplot or arcane plot program written 20 years ago.
- More detailed analysis of the data: subtracting background contributions, analysing dependencies and correlations, fitting with theoretical models. Many scientists use Origin for this task, some Matlab and Python/Scipy/Numpy usage is increasing.
- Creating professional figures, this involves adjusting to journal guidelines, mathematical typesetting and general editing. At the moment I use Origin for this but it has several drawbacks (just try to get a linewidth of exactly 0.5pt, it is not possible). For combining/polishing figures I mainly use Adobe Illustrator, as it can handle im-/export of PDF documents nicely but I would prefer not having to go through two steps for each diagram.
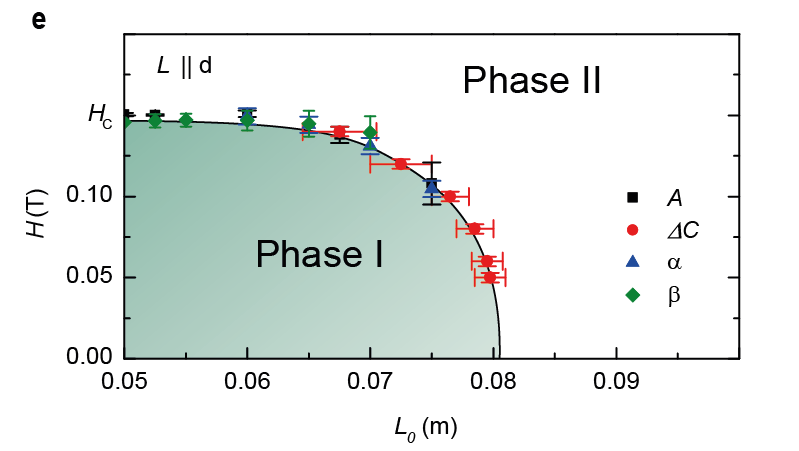
I added an example of how it might look like in the end (as this has been created mostly by hand changing anything is painful and anything that provides an interface for example to set the linewidth for all elements would be nice):