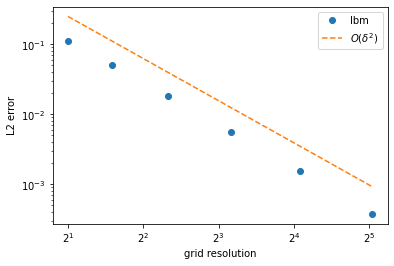
In my opinion issues in LBM like this almost always relate to the boundary condition implementation. Depending on the choice of BC and the way it is implemented it can deteriorate the accuracy of LBM from $O(\delta^2)$ (second-order) to $O(\delta^{1.5})$ or worse to $O(\delta)$ (first-order).
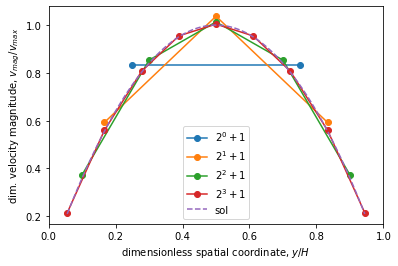
I am not familiar with the specifics of the BFL condition but if I solve this problem with halfway bounceback in a cartesian channel (rather than a pipe) then with as little as three lattice nodes (very rough grid) I get an error in $v_{max}$ of 4%. The numerical solution approaches the analytical solution quite rapidly:


With a refinement by doubling the number of nodes yields an error of 1.33%, 0.41%, etc in second-order fashion.
It is not exactly clear to me how you estimate your shear stress but given the equation I assume you determine the max velocity in the pipe and then calculate the stress. So the above errors translate directly to the error in the calculated shear stress. Another option is to determine the stresses directly from the distribution functions.
Now as to why you are getting such relatively large deviations from the FEM solution (which is order of magnitude coarser) I can only provide some potential pointers as I don't have the details of your implementations:
- A pipe is axisymmetric system for which generally we want to increase the resolution where the gradients are largest (i.e. at the walls). Standard LBM doesn't account for this as it has a constant lattice spacing but if your FEM solution does account for this you are comparing "apples and oranges".
- Furthermore, regarding the axisymmetric system, the equation you provide is a result of solving for poiseuille flow in cylindrical coordinates. Standard LBM is in cartesian coordinates and requires modification for other coordinate systems such as cylindrical coordinates. If your FEM solution is in cylindrical coordinates then again you are comparing "apples and oranges".
- Reexamine the boundary condition implementation for any bugs. In my experience this is the largest source of mistakes and one of the points that are most overlooked are the treatment of the corners (where sometimes multiple boundary types come together).
- Boundary location (at least for bounce-back) is viscosity dependent, this means that for different values of the relaxation time we can get slight deviations from theory. This is improved by using MRT rather than BGK and in particular by using TRT with a 'magic' relaxation time for which the boundary location is exact to machine precision.
Hope it helps
Code which produced the graphs:
import numpy as np
import matplotlib.pyplot as plt

def sim(n=2, Fo=1):
    """
    """
    ### parameter
    # D2Q9 lattice
    ns = 9
    cssq = 1/3
    ws = [4/9, 1/9, 1/9, 1/9, 1/9, 1/36, 1/36, 1/36, 1/36]
    ex = [0, +1, 0, -1, 0, +1, -1, -1, +1]
    ey = [0, 0, +1, 0, -1, +1, +1, -1, -1]

    # grid
    nx = 1
    ny = 2**n+1

    # quantities
    ω = 1
    vmax = 0.01
    ν = cssq*(1/ω-1/2)
    ax = 8*ν*vmax/ny**2
    ay = 0

    ### initialization
    rho  = np.ones((nx, ny), dtype=np.float)
    vx = np.zeros((nx, ny), dtype=np.float)
    vy = np.zeros((nx, ny), dtype=np.float)

    Fx = np.zeros((nx, ny), dtype=np.float)
    Fy = np.zeros((nx, ny), dtype=np.float)

    f = np.zeros((nx+2, ny+2, ns), dtype=np.float)
    ftmp = np.zeros((nx+2, ny+2, ns), dtype=np.float)

    # initialize at equilibrium
    for s in range(ns):
        feq = ws[s] # ρ=1, vx=vy=0
        f[1:nx+1, 1:ny+1, s] = feq
        ftmp[1:nx+1, 1:ny+1, s] = feq

    ### main loop
    niter = Fo*int(ny**2/ν)
    for i in range(niter):

        ### quantities
        dens = f[1:nx+1,1:ny+1,0]
        momx = 0
        momy = 0
        for s in range(1,ns):
            dens += f[1:nx+1,1:ny+1,s]
            momx += ex[s]*f[1:nx+1,1:ny+1,s]
            momy += ey[s]*f[1:nx+1,1:ny+1,s]
        rho[:,:] = dens

        Fx = dens*ax
        Fy = dens*ay

        vx[:,:] = (momx + 0.5*Fx)/dens
        vy[:,:] = (momy + 0.5*Fy)/dens

        ### collision
        vv = (vx*vx + vy*vy)/cssq;
        for s in range(ns):
            ev = (ex[s]*vx + ey[s]*vy)/cssq
            feq = ws[s]*rho*(1 + ev + 1/2*ev**2 - 1/2*vv)
            ef = (ex[s]*Fx + ey[s]*Fy)/cssq
            fforce = (1-1/2*ω)*ws[s]*(
                  (ex[s]-vx + ev*ex[s])*Fx
                + (ey[s]-vy + ev*ey[s])*Fy
            )/cssq
            ftmp[1:-1,1:-1,s] = (1-ω)*f[1:-1,1:-1,s] + ω*feq + fforce

        ### boundaries
        # x boundaries - periodic
        ftmp[0,1:-1,:] = ftmp[-2,1:-1,:]
        ftmp[-1,1:-1,:] = ftmp[1,1:-1,:]

        # y boundaries - halfway bounceback
        for (s, so) in zip([2, 5, 6], [4, 7, 8]):
            ftmp[1:nx+1, 0, s] = ftmp[1-ex[so]:nx+1-ex[so], 1, so]
            ftmp[1:nx+1, -1, so] = ftmp[1-ex[s]:nx+1-ex[s], -2, s]

        # corners - halfway bounceback
        ftmp[0, 0, 5] = ftmp[0-ex[7], 1, 7]
        ftmp[-1, 0, 6] = ftmp[-1-ex[8], 1, 8]
        ftmp[0, -1, 8] = ftmp[0-ex[6], -2, 6]
        ftmp[-1, -1, 7] = ftmp[-1-ex[5], -2, 5]

        ### streaming
        for x in range(1,nx+1):
            for y in range(1,ny+1):
                for s in range(ns):
                    f[x,y,s] = ftmp[x-ex[s], y-ey[s], s]

    return dict(
        # vars
        rho = rho,
        vx = vx, vy = vy,
        # params
        nx = nx, ny = ny,
        vmax = vmax,
    )

### figure 1 - numerical vs analytical solutions
errors = []
resolution = []
for n in range(4):
    print(f"running simulation with ny = 2^{n}+1 = {2**n+1}")
    s = sim(n=n)
    vmag = np.sqrt(s['vx']**2 + s['vy']**2)/s['vmax'] # scaled
    yrange, y0, yf = np.arange(s['ny']), -0.5, s['ny']-0.5
    sol = (yrange-y0)*(yf-yrange)/(s['ny']/2)**2
    ϵ = np.linalg.norm(vmag[0,:]-sol)/np.linalg.norm(sol)
    errors.append(ϵ)
    resolution.append(2**n+1)
    plt.plot((np.arange(s['ny'])-y0)/s['ny'], vmag[0,:], '-o', label=f"$2^{n}+1$")

yrange, y0, yf = np.linspace(0,s['ny']-1,100), -0.5, s['ny']-0.5
plt.plot((yrange-y0)/s['ny'], (yrange-y0)*(yf-yrange)/(s['ny']/2)**2, '--', label='sol')

plt.xlabel(r'dimensionless spatial coordinate, $y/H$')
plt.ylabel(r'dim. velocity magnitude, $v_{mag}/v_{max}$')
plt.xlim(0,1)
plt.legend()

### figure 2 - L2 error as function of resolution
plt.loglog(resolution, errors, 'o', basex=2, label='lbm')
plt.loglog(resolution, list(map(lambda r: r**-2, resolution)), '--', basex=2, label=r'$O(\delta^2)$')
plt.xlabel('grid resolution')
plt.ylabel('L2 error')
plt.legend()

