I'm trying to model the Black-Scholes Equation (transformed into a heat equation) using method of lines in Python.
The transformed formula is basically
\begin{equation*} \frac{\partial u}{\partial t} = \frac{\partial^2 u}{\partial x^2} + (k-1)\frac{\partial u}{\partial x} - ku \end{equation*}
where $k$ is a constant and with initial condition
\begin{equation*} u(x,0) = \max(e^x - 1, 0) \end{equation*}
and boundary conditions
\begin{equation*} u(a,t) = \alpha \hspace{35pt} u(b,t) = \beta \end{equation*}
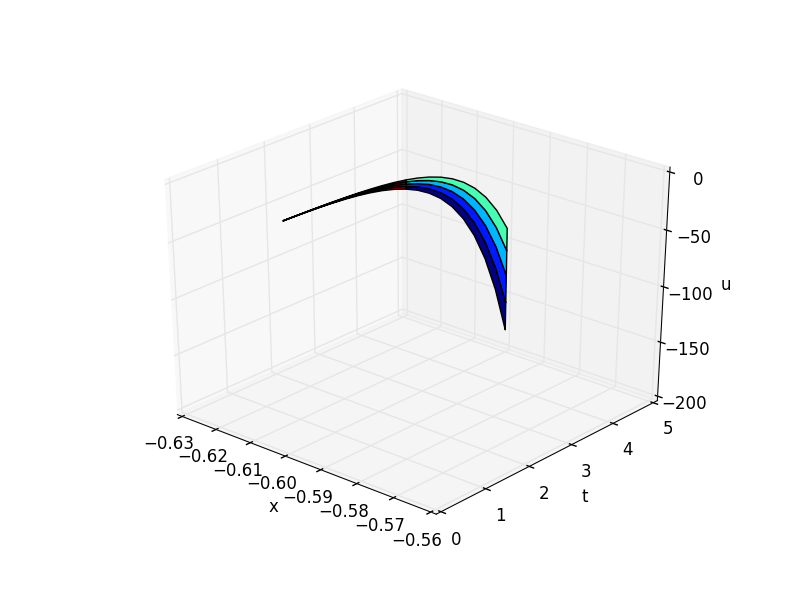
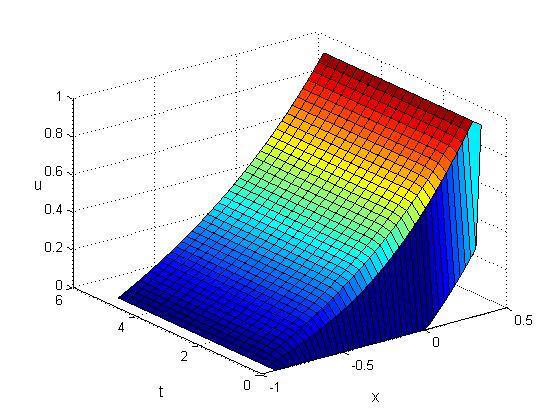
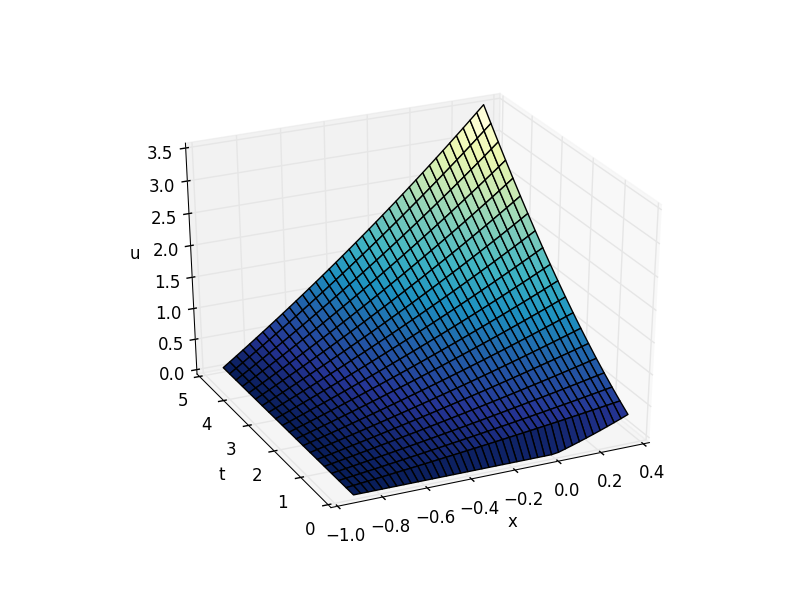
This is python implementation of the method of lines for the above equation should match the results in the matlab code here. I can't seem to find where I went wrong. Any insight on the Python code would be really helpful.
import numpy as np
from scipy.integrate import odeint
import matplotlib.pyplot as plt
from scipy.fftpack import diff as psdiff

N = 40
r = 0.065;
sigma = 0.8;
k = float(0.5*sigma**2);
a = np.log(float(2)/5)
b = np.log(float(7)/5)
t0 = 0;
tf = 5;

x = np.linspace(a, b, N);
xmesh = np.max(np.exp(a)-1,0)*np.ones(x.shape)

def odefunc(u, t):
    dudt = np.zeros(xmesh.shape)

    #boundary conditions
    dudt[0] = u[0]
    dudt[-1] = (7 - 5*np.exp(-k*t))/5

    #step size
    h = b/(N-1)

    for i in range(1, N-1):
        dudt[i] = ((u[i + 1] - 2*u[i] + u[i - 1]) / h**2) + (k-1)*((u[i] - u[i-1]) / h) - (k*u[i])
    return dudt

tspan = np.linspace(t0, tf, 20);
sol = odeint(odefunc, xmesh, tspan)

for i in range(0, len(tspan), 5):
    plt.plot(xmesh, sol[i], label='t={0:1.2f}'.format(tspan[i]))

# put legend outside the figure
plt.legend(loc='center left', bbox_to_anchor=(1, 0.5))
plt.xlabel('X position')
plt.ylabel('Temperature')

# adjust figure edges so the legend is in the figure
plt.subplots_adjust(top=0.89, right=0.77)
plt.savefig('pde.png')

# Make a 3d figure
from mpl_toolkits.mplot3d import Axes3D
fig = plt.figure()
ax = fig.add_subplot(111, projection='3d')

SX, ST = np.meshgrid(xmesh, tspan)
ax.plot_surface(SX, ST, sol, cmap='jet')
ax.set_xlabel('x')
ax.set_ylabel('t')
ax.set_zlabel('u')
ax.view_init(elev=30, azim=100) # adjust view so it is easy to see
plt.savefig('pde-transient-heat-3d.png')


