Context
Let's say I am trying to model the spread of mold in a petri dish, using a stochastic cellular automata approach. The petri dish can be thought of as a grid of 1mm x 1mm squares, each called a Cell. Each square has a value for the kind of food that is present there, and the probability of mold spreading into that Cell is based on some numerical value that can be derived from the food that is present.
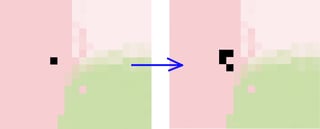
We seed the dish by saying that a certain Cell has gotten some mold on it. We then iterate over a series of timesteps. Let's say each timestep is 1 minute. Within each timestep, we iterate over every Cell that has mold on it. And for every one of those Cells, we iterate over the neighbors of the Cell in its Moore neighborhood. Based on the fuel for each neighbor, we decide whether or not it is likely in that step for the mold to spread. Here is a quick visualization of $t_0$ and $t_1$:
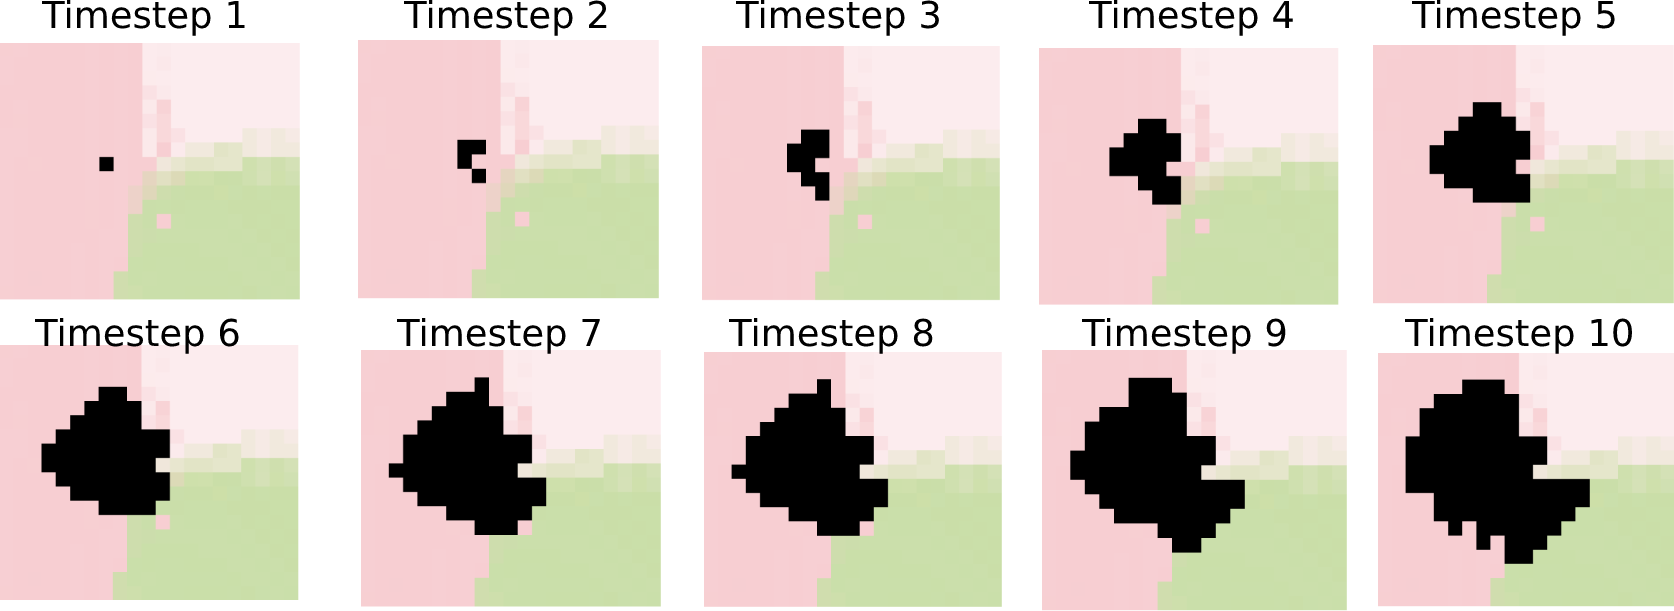
In this image, the light background colors represent data in each Cell about what food is present. The left image represents $t_0$, where a single Cell is chosen to have mold. In the right image, we have iterated one timestep, and a few of the neighbors of that Cell are calculated to have had mold spread into them. Taking this further, we can imagine a few more timesteps:
And voila, the mold is spreading.
Rate of Spread
With this type of model, the rate of spread (RoS) of mold emerges from the iterative process. For food sources that are less likely to let mold spread, the RoS will be lower, while for food sources that are more likely to let it spread, the RoS will be greater.
Now let's say that for various food sources, RoS has been empirically measured. To keep it concrete, a quick table for rate of spread for the 3 foods is here:
| food type | RoS (empirically measured) |
|---|---|
| pink food | 10 mm per hour |
| light pink food | 5 mm per hour |
| green food | 80 mm per hour |
| blue food (not shown) | 400 mm per hour |
The problem
I need to actually derive the most likely probability ($p$) for each type of food, such that the derived probability will create a model where the correct RoS emerges. A quick table with some derivations:
| food type | RoS | $p$ |
|---|---|---|
| pink food | 10 mm/hour | 0.16 |
| light pink food | 5 mm/hour | 0.08 |
| green food | 80 mm/hour | 1.33 |
| blue food (not shown) | 800 mm/hour | 13.3 |
So for pink food: after 60 timesteps (1 hour), if each Cell has a chance of 16% to grow mold, then roughly 10 Cells in a straight line will have grown mold, creating an emergent 10mm/hour RoS. Obviously there will be some variation, but that's fine.
The issue arises when the rate of spread is greater than a CellSize / TimestepInterval. In this example, the maximum speed that can be achieved is 1mm per minute, or 60mm per hour. Which means the model will never be able to accurately mimic the 80 mm/hour or 800 mm/hour spread of green or blue food.
Potential solutions
Clearly some of the assumptions that the algorithm relies on need to be changed. Some options I've been considering are:
1. Change the timestep interval
I could make a timestep interval smaller, i.e. on the order of seconds. If I take this approach, the TimestepInterval must be made small enough so that CellSize / TimestepInterval is always smaller than the maximum RoS of any of my fuel types. The probability values would also need to be adjusted to account for this. I'd prefer to avoid this, because in the case of blue food, I'd need a TimestepInterval of less than a second - this increases the algorithms computational burden by more than a factor of 10, and is wasteful is food areas with lower RoS
2. Allow for more than 1 Cell spread within a given Timestep
The model I've described assumes that within a Timestep, mold can spread from one cell to its neighbors, and that's it. It cannot spread from a neighbor to the neighbor's neighbors within a single Timestep. However, if I allowed for this, mold could potentially spread multiple Cells in a row within a given timestep, thus creating a higher RoS to match the measured values.
I've been thinking about how I could still consider $p$ as this happens. For example, for $t_x$, we iterate over all currently molded Cells. For any one of these Cells, each called $C_0$, we iterate over all first-level neighbors, called $N_0$.
- If $p$ of each $N_0$ is less than 1, we roll the dice, see if that neighbor Cell molds, and stop.
- If $N_0$ is greater than 1, we set that neighor Cell to molding, but then we iterate again over each of $N_0$'s neighbors, to a round of $N_1$ (again, all still within the same timestep $t_x$). Now for each $N_1$, we check $p$ at that cell.
- If it is less than 1, we roll the dice, see if it molds, and stop the iteration.
- However, if $p$ at $N_1$ is greater than 1, we take $p$ at $N_1$, subtract 1 (because $N_0$ already "ate up" the probably of spread with the previous iteration).
- If $p$ at $N_1$ is greater than 2, we continue on to $N_2$ - the neighbors of $N_1$. We apply the same logic. If $p$ of $N_2$ - 2 is less than 1, roll the dice, and stop. If its greater than 1, we continue on to $N_3$, and so on. If $p$ of $N_m$ is greater than $m$, we subtract $m$, and follow this same iteration.
- We continue this iteration over the neighbors until $p$ of all $N_m$ dwindles to 1. Once that happens, the $t_x$ ends and we continue on to $t_{x+1}$.
I am more inclined to go with this second route, as it only causes additional iterations and calculations where needed.
Thoughts?
Are there better solutions to this issue that rate of spread in a cellular automata model is limited by CellSize / TimestepInterval? Am I totally off base here?
I hope I am not in the wrong place, I came here as recommended by the question Where should I post questions about algorithms: Stack Overflow or Software Engineering?. Thanks for enteraining this question, just writing it all out has helped me organize thoughts.

