1
$\begingroup$

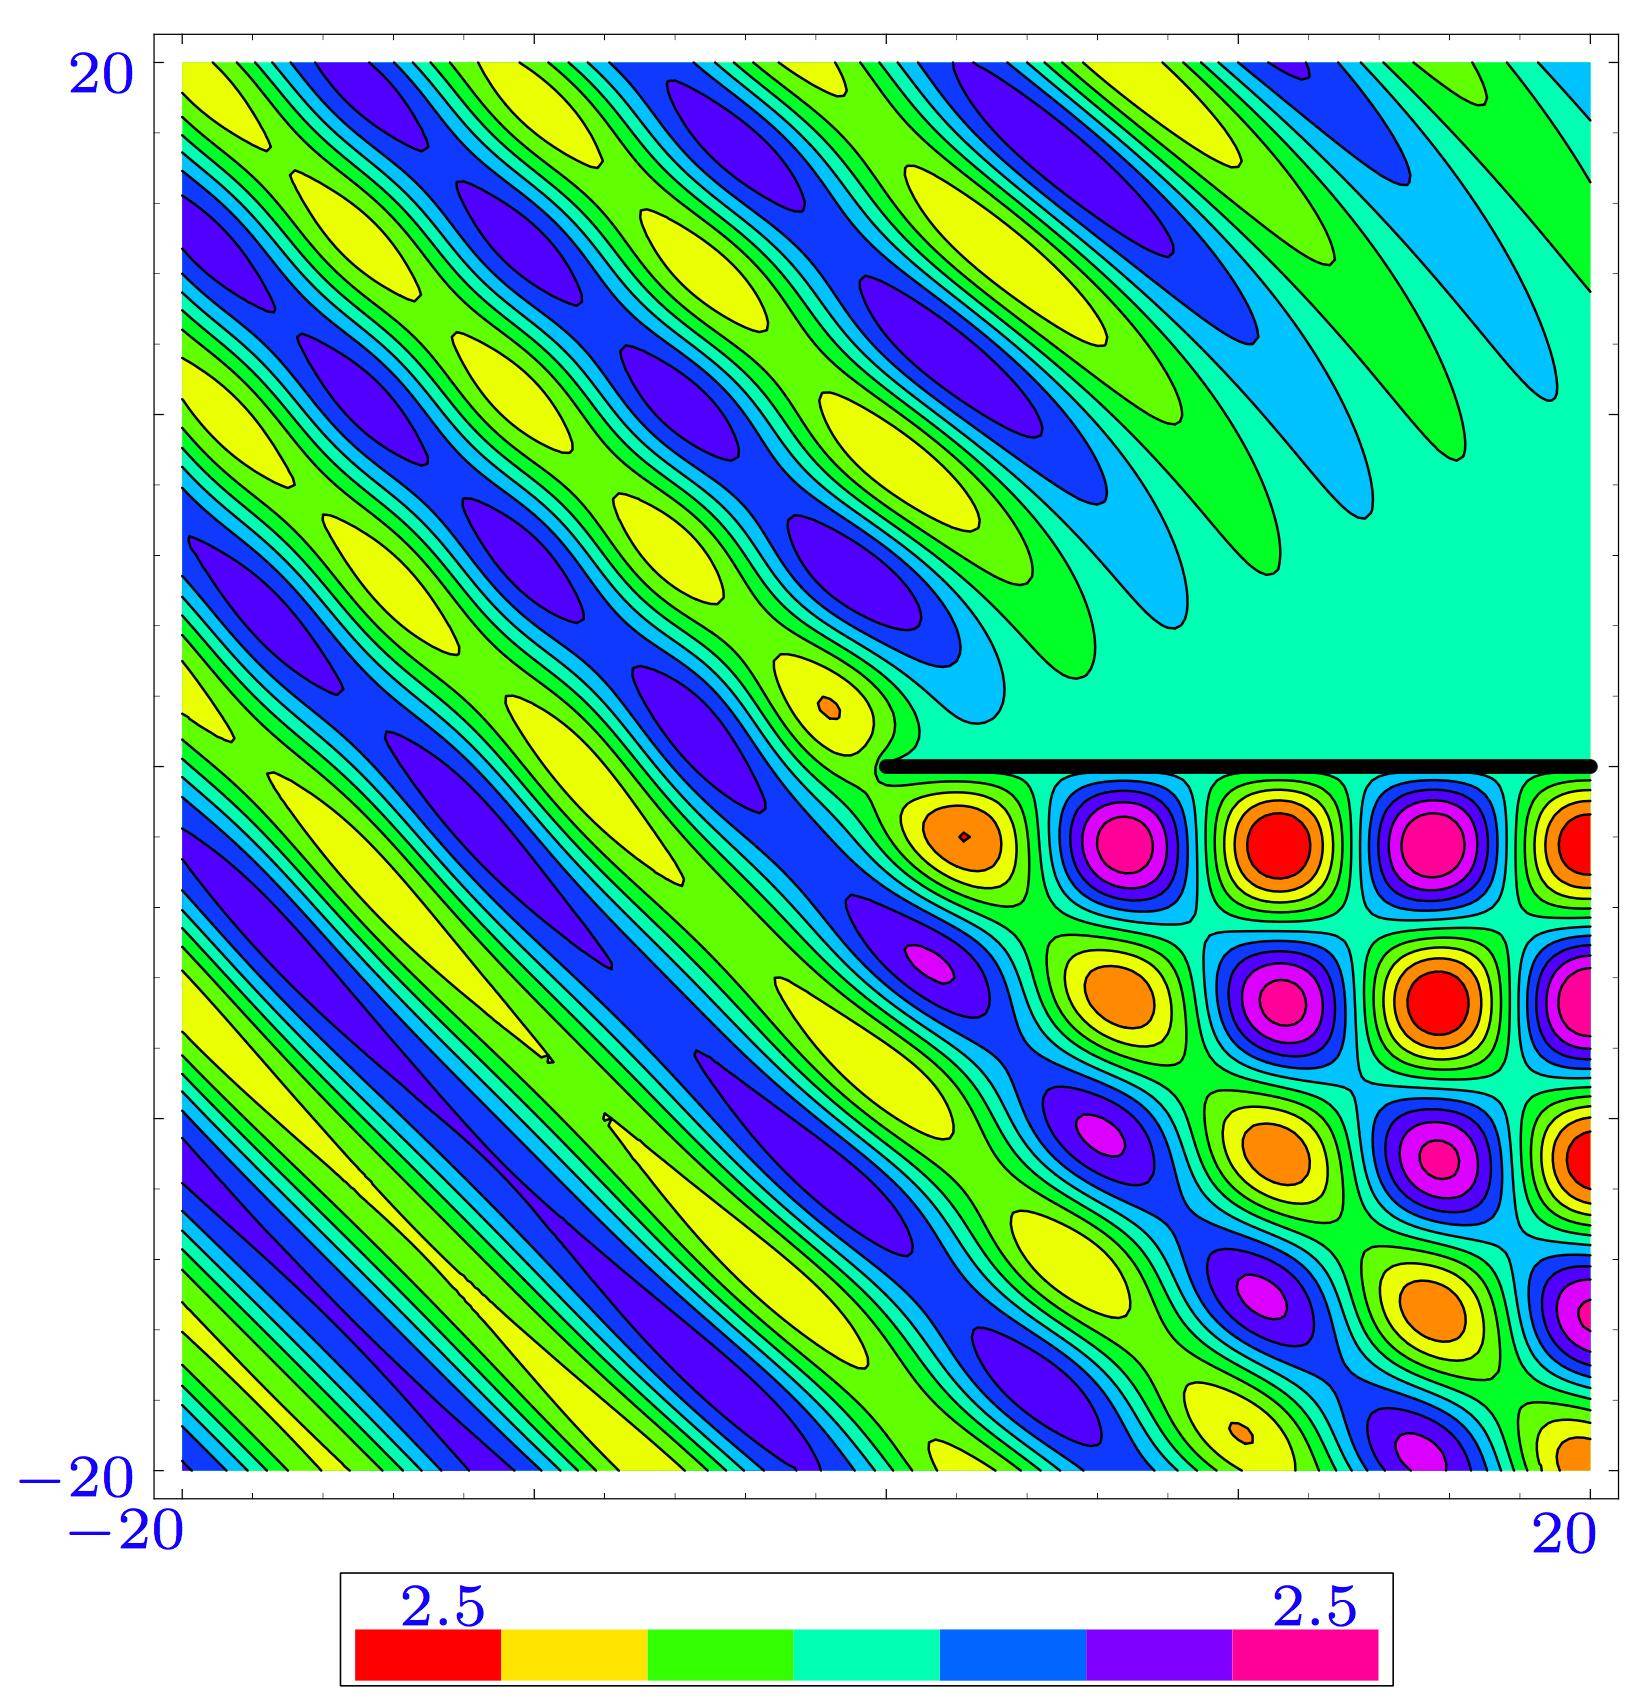
I have attempted to code up the simple math required to plot the total field set up by an incident plane wave on a semi-infinite flat plate which can be found here.

To summarise:

$$\phi_s(r,\theta ) = e^{ikr}/2 \left( w\left[ e^{i\pi/4}\sqrt{2kr}\sin(\frac{\theta + \Theta}{2}) \right]+ w\left[ e^{i\pi/4}\sqrt{2kr}\sin(\frac{\theta - \Theta}{2}) \right]\right) \enspace,$$

s the scattered potential in polar coordinates according to the article. $\Theta$ denotes the angle of the incoming plane wave and $k$ is the wave number. Finally

$$w(z) = e^{-z^2}(1-\mathrm{erf}(z)) \enspace$$

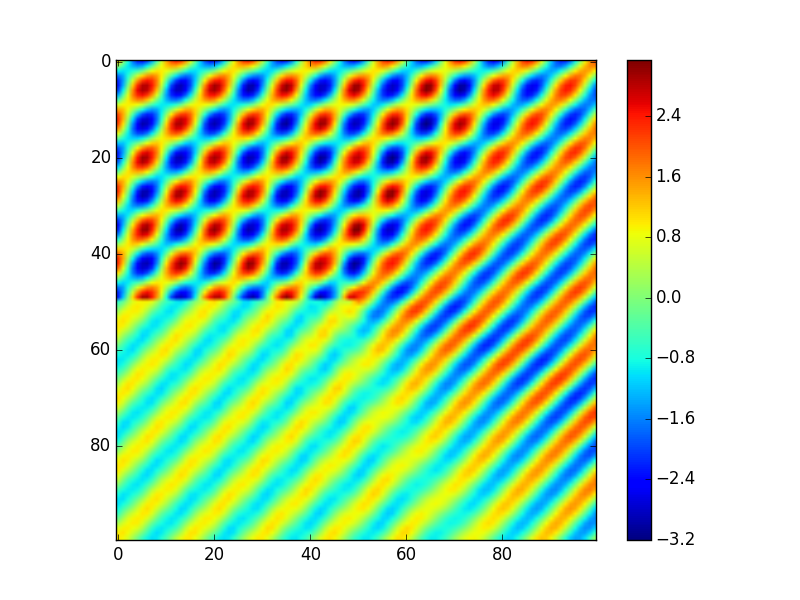
If you run the code you will see that I do not get the expected wave field as in the pictures.

My question is as follows: Have I made a mistake in my implementation or is the formula given incorrect?

My calculation: enter image description here

Their Calculation: enter image description here

My code is as follows:

import numpy as np
from scipy.special import erf
import matplotlib.pyplot as plt


"""Plane wave scattering by a plane wave incident on a seminfinite plane
"""

global T
global k
T = np.pi/4.0 # Incident plane wave angle
k = 10        # Wave number


def phi_scattered(r,t):

    W = lambda z: np.exp(-z**2)*(1-erf(z))
    term1 = W(np.exp(1j*np.pi/4.0)*np.sqrt(2*k*r)*np.sin((t+T)/2.0))
    term2 = W(np.exp(1j*np.pi/4.0)*np.sqrt(2*k*r)*np.sin((t-T)/2.0))
    res =  np.exp(1j*k*r)/2.0*(term1 + term2)

    return res

def phi_incident(r,t):
    return np.exp(1j*k*r*np.cos(t-T))


x1 = np.linspace(-50,50,100)
x2 = np.linspace(-50,50,100)
X1, X2 = np.meshgrid(x1,x2)


R = np.sqrt(X1**2+X2**2)
THETA = np.arctan2(X2,X1)

phi = phi_scattered(R,THETA) + phi_incident(R,THETA)
plt.figure()
plt.imshow(np.real(phi), vmin = np.min(np.real(phi)), vmax = np.max(np.real(phi)))
plt.colorbar()
plt.show()
$\endgroup$
5
  • 1
    $\begingroup$ What did you already do to resolve the discrepancy? Are you just looking for people to debug your code here, or what is your question concretely? $\endgroup$ Commented Aug 17, 2015 at 19:48
  • $\begingroup$ @WolfgangBangerth Hi, well Im just frustrated because as far as I can tell I have written the equations like in the reference. So I am wondering is the referenced equation correct or have I made a blatant mistake in my code? I guess I am looking for a fresh set of eyes as I cant seem to see what could be wrong. Maybe you can suggest what I would do to 'debug' it? I have tried all sorts of things, changing sines to cosines, different implementations of the error function etc. but nothing helps! $\endgroup$
    – Dipole
    Commented Aug 17, 2015 at 19:58
  • 1
    $\begingroup$ You can add some background in the question, what it is used for? What are the equations? That said, you should use the same parameters that the document, i.e, $k$, $\Theta$, $x,y$, colormap and visualization technique. If you just plot your scattered field it does not look like the reference. Check it here. $\endgroup$
    – nicoguaro
    Commented Aug 17, 2015 at 21:34
  • $\begingroup$ @nicoguaro Please see my update, I hope this helps! $\endgroup$
    – Dipole
    Commented Aug 18, 2015 at 12:27
  • $\begingroup$ You are not even plotting the same type of graphic and the parameters are not the same. That does not make the calculations right, but at least you can compare apples with apples. Check my code. Furthermore, the problem is the scattered field, so you need to check that term only (again, check my code). $\endgroup$
    – nicoguaro
    Commented Aug 18, 2015 at 13:02

1 Answer 1

1
$\begingroup$

I cannot directly answer your question, but:

1) Use contour instead of imshow, otherwise your plot is x-flipped.

2) Use the same limits for axis (that is from -20 to 20) as in the paper.

3) As others mentioned, use the same parameters as in the paper (that is k=1).

4) Styling the plot in the same way as in the paper also makes plot comparing easier.

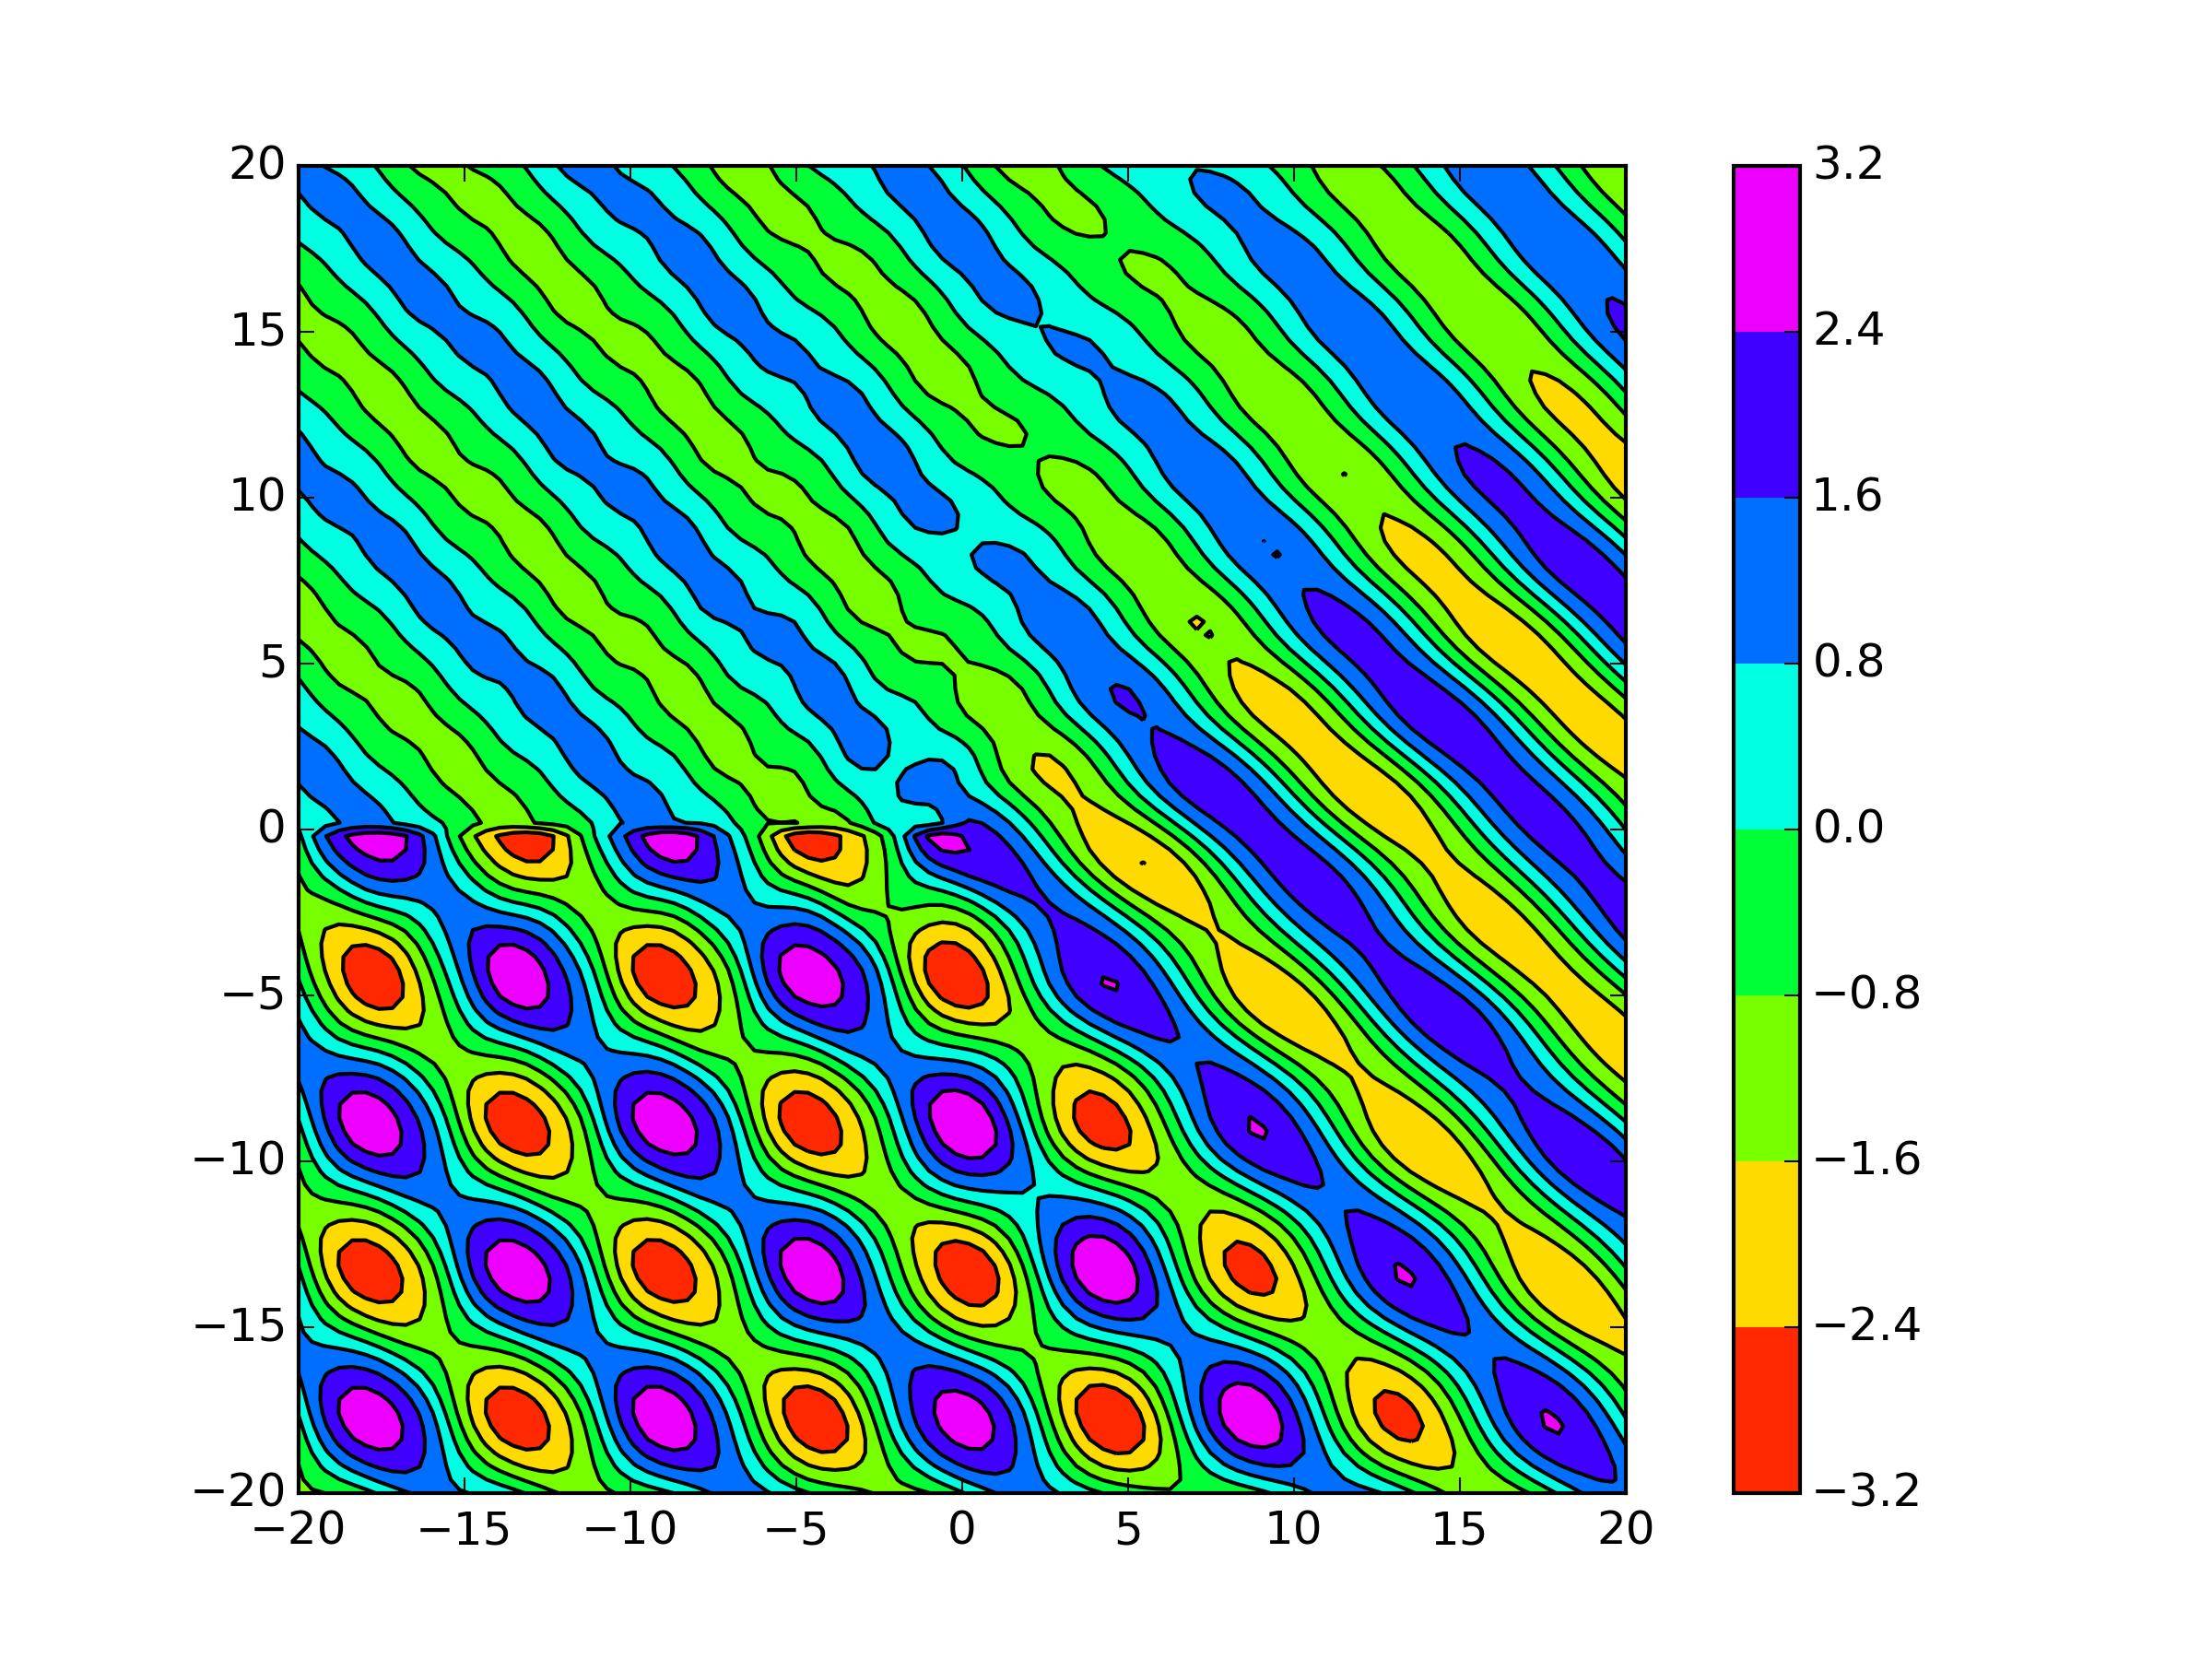
I've fixed these issues, here is the code:

import numpy as np
from scipy.special import erf
import matplotlib.pyplot as plt

"""Plane wave scattering by a plane wave incident on a semi-infinite plane"""

T = np.pi / 4.0  # Incident plane wave angle
k = 1.0  # 10  # Wave number

def phi_scattered(r,t):
    W = lambda z: np.exp(-z**2)*(1-erf(z))
    term1 = W(np.exp(1j*np.pi/4.0)*np.sqrt(2*k*r)*np.sin((t+T)/2.0))
    term2 = W(np.exp(1j*np.pi/4.0)*np.sqrt(2*k*r)*np.sin((t-T)/2.0))
    res =  np.exp(1j*k*r)/2.0*(term1 + term2)

    return res

def phi_incident(r,t):
    return np.exp(1j*k*r*np.cos(t - T))

x1 = np.linspace(-20, 20, 100)
x2 = np.linspace(-20, 20, 100)
X1, X2 = np.meshgrid(x1,x2)

R = np.sqrt(X1**2 + X2**2)
THETA = np.arctan2(X2, X1)

phi = phi_scattered(R, THETA) + phi_incident(R, THETA)

plt.figure()
plt.contourf(x1, x2, np.real(phi), cmap=plt.cm.gist_rainbow)
plt.colorbar()
plt.contour(x1, x2, np.real(phi), colors='k', linestyles='solid')
plt.axis('image')
plt.savefig('scattering.png', dpi=300)
plt.show()

The result is: Styled plot

You can see that it's flipped along x-axis.

$\endgroup$

Your Answer

By clicking “Post Your Answer”, you agree to our terms of service and acknowledge you have read our privacy policy.

Not the answer you're looking for? Browse other questions tagged or ask your own question.