1
$\begingroup$

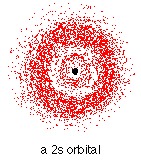
How can I make a scatter plot like the following, where the density of points represents the magnitude of the scalar field at that point. Consider for example the probability density for an atom:

Example plot

I managed to plot something like this as a color plot (see my question and the pictures here: https://stackoverflow.com/questions/36113331/pcolormesh-in-polar-coordinates) but I didn't find any option to make such a scatter plot as above.

A requirement is that it should be done with free software for linux. Preferences:

  • pgfplots or pstricks
  • mathplotlib or another python library

I am interested in such types of plots in 2d as well as in 3d.
$\endgroup$

1 Answer 1

3
$\begingroup$

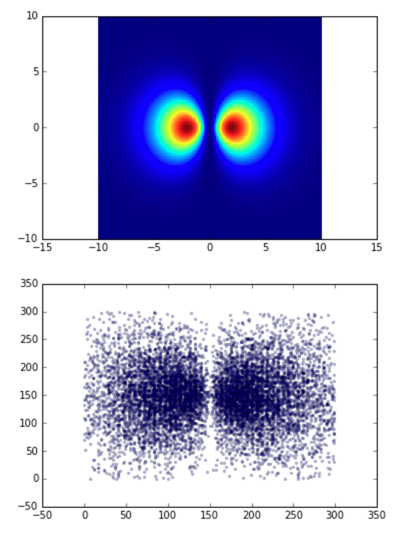
Points for a scatterplot of a probability density function can simply be sampled from it. I used the Psi(X1, X2) you defined in your linked post.

The number of sample points, alpha and the marker type can be tuned. The axis can be renormalized to the dimensions of th meshgrid.

Scatter plot of crossreferenced field

In the code below I take the absolute value of the input matrix because it had negative values. You might want to set negative values to 0 instead and add a different colored scatterplot to the same axis if you have positive and negative data.

import numpy as np
import matplotlib.pylab as plt
def sample(mat, count=10000):
    shape = mat.shape
    magn = np.abs(mat) # input should not be negative
    cumsum = magn.cumsum()

    samples = [None] * count
    for i, rand in enumerate(np.random.random(count) * magn.sum()):
        idx = np.argmax(cumsum > rand)
        samples[i] = (idx % shape[0], idx / shape[1])

    return samples

sample_x, sample_y = zip(*sample(psi(X1,X2)))
plt.figure()
plt.scatter(sample_x, sample_y, alpha=0.25, marker=".")
$\endgroup$

Your Answer

By clicking “Post Your Answer”, you agree to our terms of service and acknowledge you have read our privacy policy.

Not the answer you're looking for? Browse other questions tagged or ask your own question.