0
$\begingroup$

Suppose i have a bunch of 10 data points and i have to conclude whether the increase is $n^2,n^3,\cdots,2^n,3^n, e^n,\cdots$.

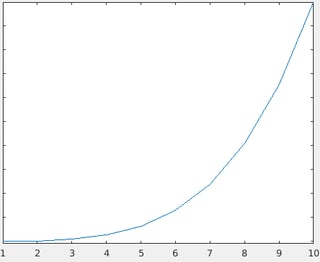
For example i have the image:-

enter image description here

Now the increase is either polynomial or exponential. First question is how to decide that?

Case 1: increasing polynomially, i.e., $n^c$

Then how to find constant $c$?

Case 2: increasing exponentially, i.e., $c^n$

Then how to find constant $c$?

Is there a comprehensive pseudocode that solves this?
$\endgroup$
2
  • $\begingroup$ you could try approximating the derivative numerically. if the approximation looks like your original data then you've got a heuristic justification for saying it's exponential growth since the exponential function is proportional to its own derivative. likewise, if the derivative looks different from your original data you could argue that it's polynomial $\endgroup$ Commented Sep 14, 2017 at 22:08
  • $\begingroup$ You could compute the ratio of consecutive y values, if it is constant you have an exponential grow. $\endgroup$
    – nicoguaro
    Commented Sep 15, 2017 at 0:47

1 Answer 1

4
$\begingroup$

Plot your data in two different ways:

  1. $\log(y)$ vs $x$
  2. $\log(y)$ vs $\log(x)$

If your data appears to be linear in the first case, then your data takes the form $y(x) = A\cdot c^x$, and the line will have slope $\log(c)$. This can be seen from the relation $\log(y) = \log(A\cdot c^x) = \log(c) x + \log(A)$.

If your data appears to be linear in the second case, then your data may come from a function of the form $y(x) = A\cdot x^c$, and the line will have slope $c$. This can be seen from $\log(y) = \log(A\cdot x^c) = c\log(x) + \log(A)$

I will mention that if your polynomial-generated data has a non-zero intercept, this can sometimes make it appear exponential if your range of $x$ values is not large. It is best if you have some idea going in to determine whether your data should have exponential or polynomial behavior. This can help you when you are cleaning your data before applying this technique. This effect is obviously exacerbated if your data is noisy, because it is much more difficult to remove the intercept without driving any y-values below 0 (your regression will complain about complex numbers...).

$\endgroup$
3
  • $\begingroup$ "appears to be linear" is not a valid statistical test. $\endgroup$ Commented Sep 14, 2017 at 23:15
  • $\begingroup$ Very well. You can fit a line to the log-lin or log-log data and look at the residuals. If the residuals show no correlation to other variables in his problem or any autocorrelation, then the regression may be ok. The Durbin-Watson test may be used to check for the presence of autocorrelation. If regressing on both models looks like it should work, then I'd argue that he has insufficient data. If neither model works, then he probably needs to clean up the data a bit more or think of another model. @DaveKielpinski Can you think of anything else that may also help? $\endgroup$ Commented Sep 15, 2017 at 0:11
  • $\begingroup$ I like your point about the autocorrelation of the residuals, that's an interesting perspective! I usually compare the reduced chi-squared of the fit for different trial models. Intuitively, it seems like a model that reduces the chi-squared will always reduce the autocorrelation, but not vice versa. I could be wrong about that though. $\endgroup$ Commented Sep 15, 2017 at 1:16

Your Answer

By clicking “Post Your Answer”, you agree to our terms of service and acknowledge you have read our privacy policy.

Not the answer you're looking for? Browse other questions tagged or ask your own question.