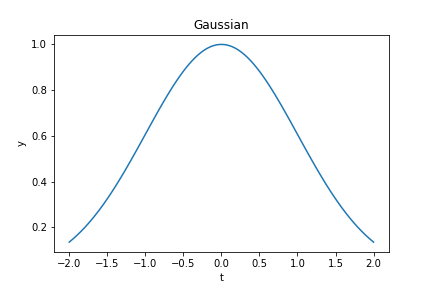
I'm trying to estimate the percentage error in computing the integral of a Gaussian via composite trapezoidal rule versus via an exact formula. To do this I've generated a gaussian with mean 0, standard deviation $\sigma = 1$ and amplitude $A = 1$ in Python (plotted below), on a grid of $N$ points in the range $[-2\sigma,2\sigma]$, and used scipy.integrate.trapz to compute the approximate integral $A$ for a range of different $N$.
For the exact integral I used the formula $I = \int_{-x}^{x}e^{\frac{-t^2}{2\sigma^2}} dt = \sqrt{2\pi}\sigma\text{erf}(\frac{x}{\sqrt{2}\sigma})$ to compute the exact integral between $\pm$ two standard deviations of the mean as $I = \int_{-2\sigma}^{2\sigma}e^{\frac{-t^2}{2\sigma^2}} dt = \sqrt{2\pi}\sigma\text{erf}(\sqrt{2})$, or
$I = \sqrt{2\pi}\text{erf}(\sqrt{2})$
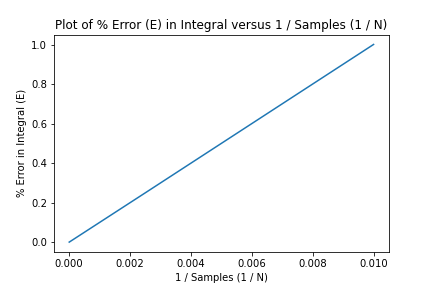
in this $\sigma = 1$ case. The % error is then $E = \frac{|I - A|}{I}\cdot 100$. Below is a plot of $\frac{1}{E}$ versus $N$
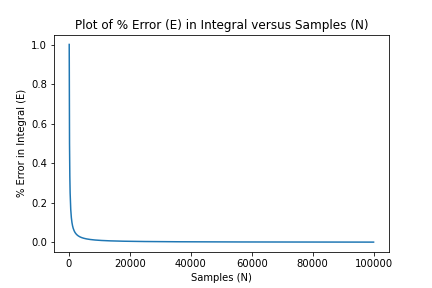
and for reference a plot of $E$ verus $N$.
Now I would expect $E \propto \frac{1}{N^2}$ but this is not seen here. Would anyone be able to help me figure out why?
I've included my code below. Thank you in advance!
from scipy.integrate import trapz
from scipy.special import erf
import matplotlib.pyplot as plt
import numpy as np

errs = np.array([]) # Errors in integral estimates
Ns = np.array([]) # Sample sizes tried

def get_percent_err(N, errs, Ns):
    A = 1 # Amplitude of Gaussian
    std = 1 # Standard deviation of Gaussian
    r = 2*std # Extent of domain
    dt = 2*r/N # Step
    t = np.linspace(-r,r,N) # Domain
    gauss = A*np.exp(-((t)**2)/(2*(std**2))) # Gaussian function

    actual_area = np.sqrt(2*np.pi)*A*std*erf(np.sqrt(2)) # Exact gaussian integral from -2*std to +2*std
    est_area = trapz(gauss, dx=dt) # Estimated integral via trapezium rule
    percent_err = (abs(actual_area - est_area)/actual_area)*100 # Percentage error

    errs = np.append(errs, percent_err)
    Ns = np.append(Ns, N)

    return errs, Ns

# Sweep through a range of sample sizes and obtain errors for each
min_samples = 100
max_samples = 100100
sample_step = 100
samples = np.arange(min_samples,max_samples,sample_step)

for N in samples:
    errs, Ns = get_percent_err(N, errs, Ns)

# Plot reciprocal of error in integral against sample size
plt.figure()
plt.plot(1/Ns,errs)
plt.xlabel("1 / Samples (1 / N)")
plt.ylabel("% Error in Integral (E)")
plt.title("Plot of % Error (E) in Integral versus 1 / Samples (1 / N)")
UPDATE:
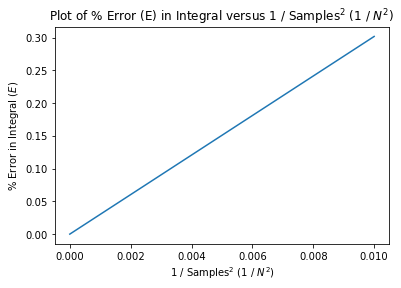
For reasons that are unknown to me (though I believe it has something to do with numerical precision), this code, adapted from this link, gives an expected result.
Code:
import numpy as np
import matplotlib.pyplot as plt
from scipy.special import erf
from scipy.integrate import trapz as trapz_scipy
from pandas import DataFrame

def trapz(f,a,b,N=50):
    x = np.linspace(a,b,N+1) # N+1 points make N subintervals
    y = f(x)
    dx = (b - a)/N
    T = trapz_scipy(y, dx=dx)
    return T

def get_err(N, errs):
    A = 1
    std = 1
    f = lambda x : A*np.exp(-x**2/(2*std**2))
    a = -2*std; b = 2*std;

    I = np.sqrt(2*np.pi)*A*std*erf(np.sqrt(2))
    T = trapz(f,a,b,N)
    return np.append(errs, 100*np.abs(I - T)/T)

min_samples = 10
max_samples = 1000
sample_step = 10
sample_sizes = np.arange(min_samples,max_samples+sample_step,sample_step)

errs = np.array([], dtype=np.float64)

for s in sample_sizes:
    errs = get_err(s, errs)

err_vs_sample_size = DataFrame({'% Error' : errs, 'Samples' : sample_sizes})

plt.figure()
plt.plot(1/sample_sizes**2,errs)
plt.xlabel("1 / Samples (1 / N)")
plt.ylabel("% Error in Integral (E)")
plt.title("Plot of % Error (E) in Integral versus 1 / Samples (1 / N)")
Error plot:


