1
$\begingroup$

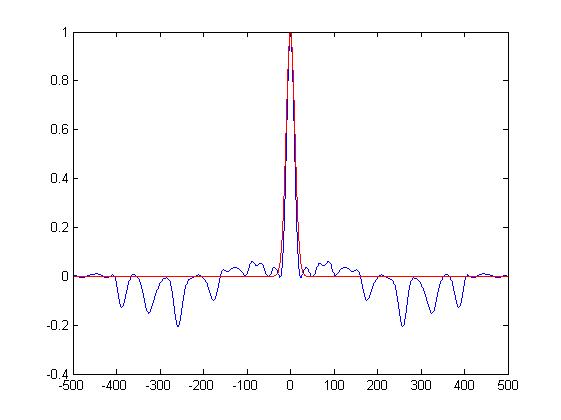
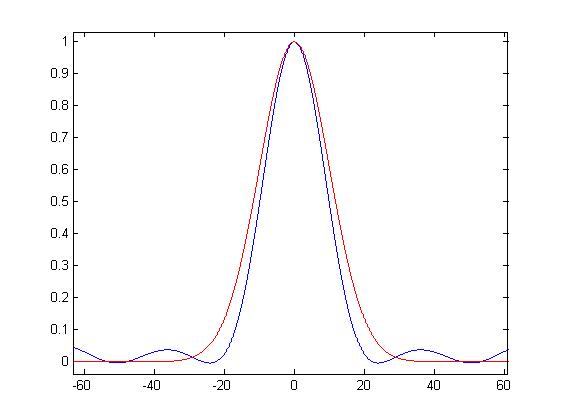
I have written some code, to produce some data. In what I have shown below, the output is just one-dimensional array of numbers. I have an analytical expression for what the autocorrelation function of this data should look like. My problem is, that it doesn't look like that, when I use matlabs built-in function xcorr. I don't know why that is, but I was hoping some of you might be able to tell me.

I have attached two graphs, to show you what I mean. The graphs herein are normalized, by the way. The red graph is the expected autocorrelation function, and the blue is the measured one. (Sorry for the horrible images - I don't know why matlab does that).
enter image description here enter image description here

As you can see, there seem to be some sort of oscillations, or something like that. Is that to be expected?

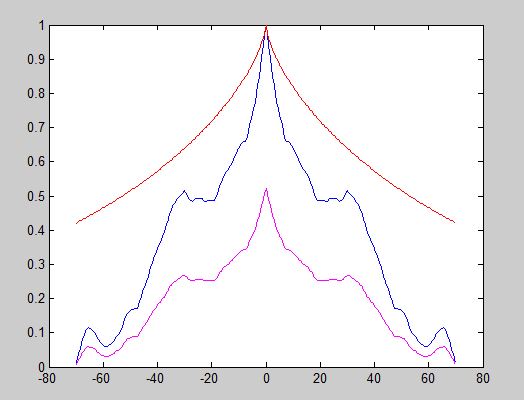
This is actually somewhat of a toy-example. The code I really (really) need to get working, produces a 4D array - actually a discretized 3D vector field. The measured autocorrelation of this output is far uglier than this. I will upload some graphs in a while.

UPDATE: Here is a graph showing the measured autocorrelation of the produced 3D vector field. Once again, sorry for the poor quality. The blue graph shows the output of xcorr(V,'coef'), the purple graph shows the output of xcorr(V,'biased') and the red is how it is actually supposed to look. If I move the purple graph, so that its maximum is 1, the middle part of the graph is pretty close to the red graph - but is this just a coincidence? enter image description here
$\endgroup$

1 Answer 1

1
$\begingroup$

Your question is not very clear - there may always be differences in the computed autocorrelation and the theoretical (expected) autocorrelation due to noise in the data. Are you sure you are not having any? The more noise your data has, the lesser the chances of you getting a smooth correlation plot. Usually the wiggles in the plot indicate presence of pockets of randomness - which is what noise is. compute the autocorrelation using 2 different software packages - if you see a difference, then it might be a programming issue. Else I do not see what is wrong with this. The analytical autocorrelation does not always match with what you get from the measured data,which is prone to noise and measurement/computation errors.

$\endgroup$
4
  • $\begingroup$ I know it's not; I'm having a hard time figuring out what to ask. But thanks a lot for your answer! The data I produce is actually a convolution of a stochastic process with a deterministic kernel alone. So there naturally is some noise. The autocorrelation function of this data can (in theory) be given in terms of the kernel alone. But as you can see, it doesn't match very well. Could it have something to do with the arguments I give to xcorr? $\endgroup$
    – torbonde
    Commented Aug 9, 2013 at 7:40
  • $\begingroup$ Hmmm.. I'm not aware of arguments in xcorr which could show such a drastic change. The only thing I can think of is the normalization of autocorr.Look at the mathworks.com/help/signal/ref/xcorr.html for documentation of "coeff" and "biased". It does look like you are normalizing the two autocorr results differently, and hence you get different peak values. Also, the wiggles should definitely be due to the noise. $\endgroup$
    – atmaere
    Commented Aug 11, 2013 at 2:33
  • $\begingroup$ The two autocorr results are being normalized differently, hence the different looks. The real problem is that none of them really looks much like expected. But I just came to think of something. Couldn't it help me if I ran the code several times, and then took the mean of the results? I mean, that should smoothen out some of the wiggles, but preserve the correlation structure, right? $\endgroup$
    – torbonde
    Commented Aug 11, 2013 at 10:03
  • $\begingroup$ If the computation isn't expensive for your dataset, that might be a decent option.I would suspect the wiggles to somewhat vanish, but the overall curve of your plot, including the peak values would be pretty much same... $\endgroup$
    – atmaere
    Commented Aug 12, 2013 at 5:28

Your Answer

By clicking “Post Your Answer”, you agree to our terms of service and acknowledge you have read our privacy policy.

Not the answer you're looking for? Browse other questions tagged or ask your own question.