5
$\begingroup$

I'm wondering if there is something analogous to a PCA for data sets where there is a dependent variable. (Though I am interested in any method of dimensionality reduction, PCA is just an example.) A PCA will take a 64-dimensional data set (say) and might return 4 dimensions which explain 95% of the variance. From a 4-point vector in the new space and the covariance matrix you could recover the original record with pretty good fidelity in this example.

So what about the case where x has 64 dimensions, and the data have the form (x, y) where y is a measurement? Is there something similar, that will let me predict y from a lower dimensional set of inputs? I.e., y $\approx$ g(x'), where dim(x') < dim(x), and there is a map m: x' $\mapsto$ x. (y' = g(x') and another map p: y' $\mapsto$ y is fine too.)

Often what people do in this situation is choose a model such as a GLM and do a partial regression, eliminating those dimensions where the regression coefficients are close to 0. However I'm looking for a method which does not assume any kind of model at all. Do these exist?

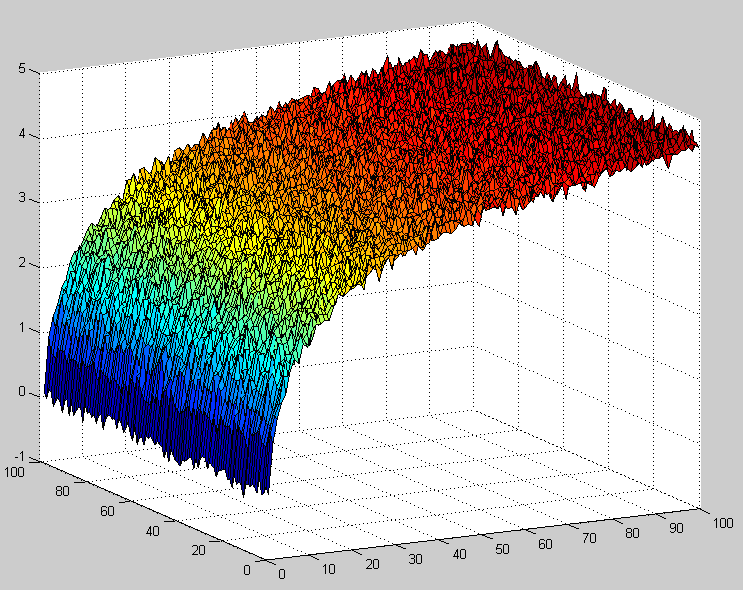
The image below illustrates an extreme case of this. Nominally the data is 2-dimensional, but the y-dimension is just a bit of 0-mean noise--z can be estimated well enough on the basis of x alone. So I'm wondering if there's a technique which will derive this, here but also cases where the redundancy is less obvious.
enter image description here

$\endgroup$
9
  • 2
    $\begingroup$ Welcome to SciComp.SE! I think what you are looking for is called "nonlinear dimensionality reduction" or "manifold learning"; this is a very active research area - take a look at the wikipedia entry. $\endgroup$ Commented Aug 22, 2014 at 13:42
  • 2
    $\begingroup$ For reference: also posted at math.stackexchange.com/q/906017 (cross-posting is usually discouraged on the SE network; in my opinion the question would be slightly more on topic here, although the community on Cross Validated would have even more expertise, see stats.stackexchange.com/questions/110185/…) $\endgroup$ Commented Aug 22, 2014 at 13:54
  • $\begingroup$ @ChristianClason I've gone ahead and deleted the Math.Stackexchange version. I posted there and then discovered this site, and being unsure about where it was better suited, I decided to violate SE etiquette for a little bit and leave it in both places. I'll check out CV, thanks. $\endgroup$ Commented Aug 22, 2014 at 14:01
  • $\begingroup$ @ChristianClason nonlinear dimensionality reduction looks promising, not surprised to find out it's a whole subfield, thanks. $\endgroup$ Commented Aug 22, 2014 at 14:08
  • 1
    $\begingroup$ $|y-g(x')|$ is a scalar for each specific value of $x'$, but it's really a function of $x'$. It's common, for example, for some parts of the domain of $x'$ to be more important than others, in which case you place more weight on $|y-g(x')|$ being lower there than somewhere else. You likely have no reason to expect the residual $|y-g(x')|$ to be uniformly small everywhere in the domain. $\endgroup$
    – Kirill
    Commented Aug 22, 2014 at 22:01

2 Answers 2

5
$\begingroup$

Take a look at active subspaces, e.g., Active Subspace Methods in Theory and Practice: http://epubs.siam.org/doi/abs/10.1137/130916138

And a PDF here: http://inside.mines.edu/~pconstan/docs/constantine-asm.pdf

I have a SIAM book (Active Subspaces: Emerging Ideas for Dimension Reduction in Parameter Studies) coming out in March.

Suppose $f$ maps $\mathbb{R}^m$ to $\mathbb{R}$. One model that addresses what you're looking for is

$$ f(x) \approx g(W^T x), $$

where $W$ is $m\times n$, and $g$ is a function that maps $\mathbb{R}^n$ to $\mathbb{R}$. In active subspaces, $W$ is the first $n$ eigenvectors of the symmetric, positive semidefinite matrix,

$$ C = \int (\nabla f)(\nabla f)^T\rho\,dx, $$

where $\rho=\rho(x)$ is a given density function on the domain. The paper I linked to discusses how to estimate $W$ and how to construct $g$---along with error estimates.

Here's a video of the process of exploiting active subspaces for constructing response surfaces (i.e., surrogate models or metamodels): https://www.youtube.com/watch?v=mJvKzjT6lmY

However, in the figure you show, the function is noisy, so the exact gradient might not be the best choice; those eigenvectors will pick up directions associated with the high frequency noise. In the statistics literature, your problem goes by the name sufficient dimension reduction, which is set in the context of regression (i.e., supervised learning) with one set of variables designated as predictors (the independent variables) and the other set designated responses (the dependent variable). Take a look at Dennis Cook's book Regression Graphics, which is my favorite overview of the field. And yes, sufficient dimension reduction is an entire subfield of statistics.

EDIT: I updated the video link, the book is now published by SIAM, and we have a new active subspaces website.

$\endgroup$
0
$\begingroup$

I think it might be helpful to perform a tensor product spline interpolation or rather, approximation by least squares as the data is noisy, e.g., by using Matlab's Curve fitting toolbox, and see whether the coefficients along certain dimensions tend to zero, meaning it's a low (hopefully 0-) order polynomial along that dimension.

$\endgroup$

Your Answer

By clicking “Post Your Answer”, you agree to our terms of service and acknowledge you have read our privacy policy.

Not the answer you're looking for? Browse other questions tagged or ask your own question.