12
$\begingroup$

So-called quadtree and octree grids are quite attractive for applications requiring adaptive mesh refinement. They are for example used in Gerris and Paramesh. Is anyone aware of a good file format for such grids, and supporting visualization software? See also this answer in the Gerris FAQ. The only potential candidate that I'm currently aware of is the VTK HyperOctree class, but there seems to be almost no documentation.

As a specific example of a mesh, consider a sparsely refined octree grid, consisting of $10^4$ boxes, each containing $8 \times 8 \times 8=512$ cells. My current strategies in Visit/Paraview are:

  1. Write the grid as a unstructured VTK file. This is expensive for larger datasets, and does not exploit the 'structuredness' of the quad/octree.
  2. Collect neighboring 'boxes' in the tree into larger blocks, and write a block-structured grid. This involves quite a bit of extra code, and loses the connectivity information embedded in the quad/octree.

Update If there is currently no viable format for directly writing and visualizing an octree grid, I would appreciate suggestions for a file format that can be used to write the octree as a block-structured grid. Ideally, this format:

  1. Has a relatively simple definition/implementation, ideally open source and with C/Fortran compatibility.
  2. Can efficiently handle a large number of grid blocks (e.g. 1000 or more).
  3. Allows to easily specify the connectivity of grid blocks, in particular at refinement boundaries.

I'm currently using Silo for this purpose, but I'm looking for something that scores better on the above three points (smaller, faster, simpler).
$\endgroup$
6
  • 1
    $\begingroup$ Why does the unstructured mesh create too much data? It would only be 5 million cells. That's a pretty small data set for me to visualize in Visit or Paraview. $\endgroup$ Commented Apr 11, 2016 at 2:29
  • $\begingroup$ Because the coordinates and connectivity are specified per cell, instead of only once per box (containing e.g. 512 cells). For larger datasets (e.g., 20 million cells or more) visualization becomes much slower than with a block-structured mesh, in particular if significant parts of the grid are at the same refinement level. $\endgroup$ Commented Apr 11, 2016 at 11:02
  • $\begingroup$ Perhaps the list of supported file formats in Visit is useful for this question: visitusers.org/… $\endgroup$ Commented Apr 12, 2016 at 21:31
  • 1
    $\begingroup$ Maybe also look at what CHOMBO, SAMRAI etc do for visualization? $\endgroup$ Commented Apr 13, 2016 at 16:03
  • 1
    $\begingroup$ Add BoxLib to the list. They have developed a package called AMRVis to visualize AMR data. The code is available from the LBL website. $\endgroup$ Commented Apr 13, 2016 at 16:10

1 Answer 1

3
+25
$\begingroup$

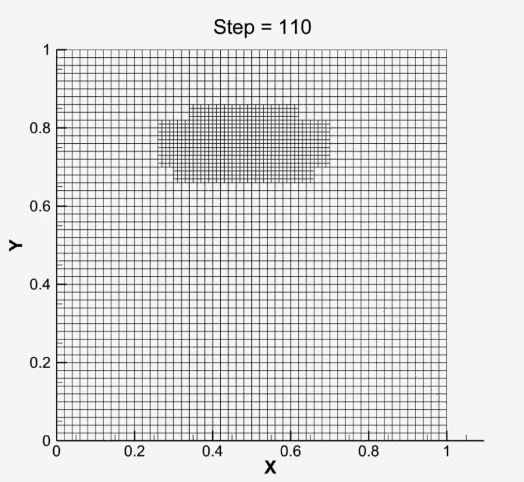
In my case when I was doing the multilevel refinement, I used to write grid files at different levels separately. Usually the level 0 is a base coarse mesh which remains fixed. And for level 1 and up, I used different files for different patches. Say if you have 5 fine patches on level 1, my strategy was to write five different files at the end of my program, something like Level_1_Patch_1,Level_1_Patch_2... which could dynamically be done in C (never worked in Fortran).

        char filename1[64];
        sprintf(filename1, "Patch%d.dat", patch_number);
        
        FILE *file;
        file= fopen(filename1, "wb");

I should mention here that I used a finite difference, structured grid system.

So once I had all the levels and their .PLT or .DAT files. I import all of them in TecPLOT. For example, when I was writing my two-level code with a couple of fine patches on level 1, your mesh should look like this in Tecplot.

enter image description here

I am not very familiar with handling unstrucutred grids but structured ones are handled well in Tecplot

$\endgroup$
3
  • $\begingroup$ Interesting to read about your approach, but this does not seem viable for a large octree, then you'd have to write and read thousands of files, which is usually rather slow. $\endgroup$ Commented Apr 13, 2016 at 13:45
  • 1
    $\begingroup$ @JannisTeunissen : If you are going for a block structured solution, for Tecplot, all the blocks can be written into the same file as separate "Zones"(tecplot terminology). They do not have to be separate files. However, parallel I/O is not there. Large datasets will choke. The tecplot files can be loaded into ParaView though (Tecplot is proprietary). The ascii format is very straightforward. With some effort, you could directly write binary files as well in tecplot format. There is an official library called TecIO which you could link your code to create the files more easily. $\endgroup$ Commented Apr 13, 2016 at 16:00
  • $\begingroup$ I don't think that would work better than my current approach with Silo, which (importantly) is open source. Note that ASCII files are not really viable for this problem. $\endgroup$ Commented Apr 13, 2016 at 21:13

Your Answer

By clicking “Post Your Answer”, you agree to our terms of service and acknowledge you have read our privacy policy.

Not the answer you're looking for? Browse other questions tagged or ask your own question.