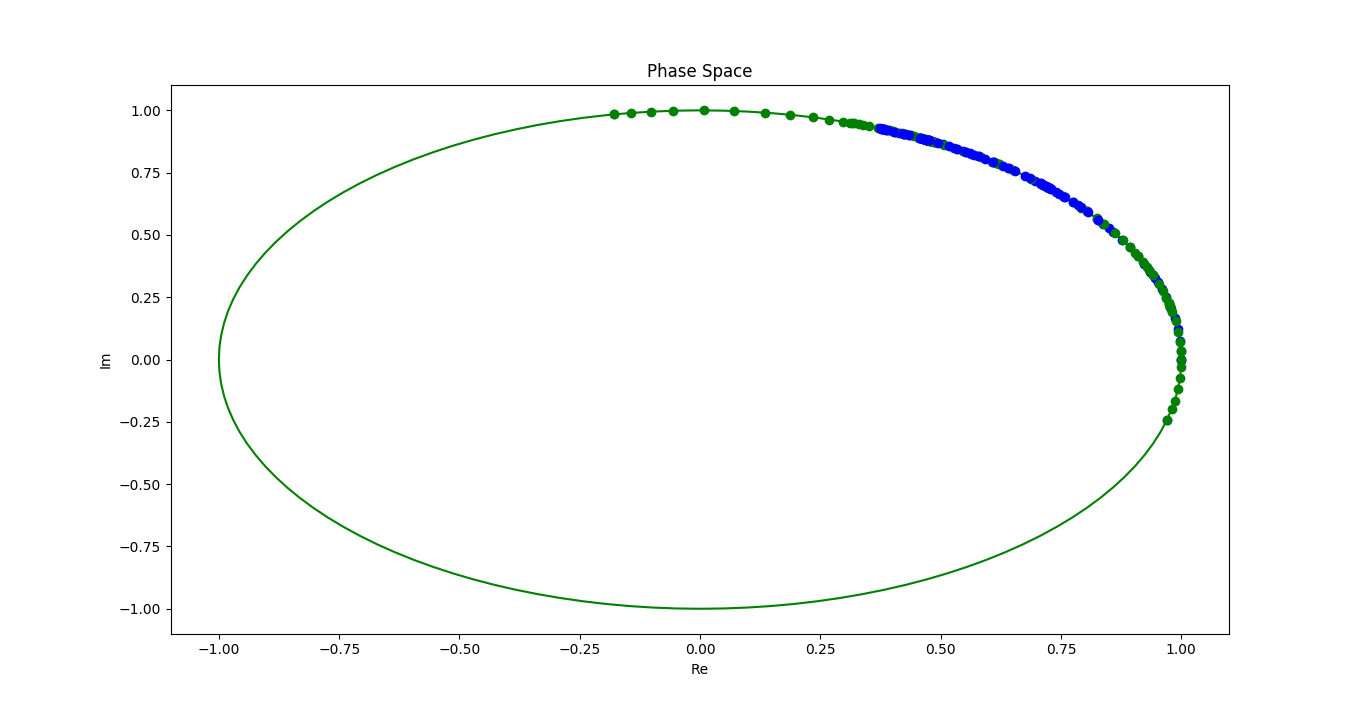
I am trying to animate a plot of two distinct points (blue and green points) moving about the complex unit circle using Python's Matplotlib library. The problem I am having is that the animation does not remove and update the previous data points but rather sequentially smears it on the unit sphere as in the accompanying image. Hence the animation is just a smudging of the various data points as shown in the image. What I am trying to achieve is two distinct points moving about the unit circle as a function of time.
The following is the part of my code where I call 'animation.FuncAnimation' using data in arrays which I call 'A' and 'B'.
##Python Code for Executing Animation##
import matplotlib.animation as animation
import matplotlib.pyplot as plt
import numpy as np
from pylab import *

#Example Data
A = array([0., 0.03435915,  0.06328989, 0.0880305, 0.14199928, 0.2044361, 0.26287941,  0.32484623])
B = array([ 1.75, 1.71564086, 1.69358362, 1.68499179, 1.68255084, 1.67808712, 1.66169597,  1.64407287])

# Total time.
T = 1.0
# Number of steps.
NS = 100
# Time step size
dt = T/NS
t = np.linspace(0.0, NS*dt, NS+1)

# So here are a few utility functions for multiplying scalars and vectors.
# a scalar times a vector returns a vector
def scale_vector(scale, vector):
  result = [0]*len(vector)
  for i in range(len(result)):
    result[i] = scale * vector[i]
  return result

# dot product of two vectors = sum(x[0]*y[0] + ... + x[n-1]*y[n-1])
def vector_dot(vector1, vector2):
  result = 0
  for i in range(len(vector1)):
    result += vector1[i] * vector2[i]
  return result

# return real part of a vector
def real_vector(vector):
  return map(lambda x: x.real, vector)

# return imaginary part of a vector
def imag_vector(vector):
  return map(lambda x: x.imag, vector)

## Creating complex unit circle
r = []
im = []
def main():
  # Generate numbers around the complex unit circle.
  N = 128
  theta = scale_vector(2*pi/N, range(N))
  exp_theta = map(lambda x: exp(1j * x), theta)

  real_part = real_vector(exp_theta)
  imag_part = imag_vector(exp_theta)

  r.append(real_part)
  im.append(imag_part)

  # And wait until the user is done with it.
  done = raw_input("done? ")

if __name__ == "__main__":
  main()

#Form two arrays which have the real and imaginary components of the unit circle
r2 = r[0][:]
im2 = im[0][:]

##Code for Animation##
Aan = np.zeros([len(A),2], float)
for i in range(2):
  for j in range(len(A)):
    if i == 0:
      Aan[j][i] = math.cos(A[j])
    elif i == 1:
      Aan[j][i] = math.sin(A[j])

Ban = np.zeros([len(B),2], float)
for i in range(2):
  for j in range(len(B)):
    if i == 0:
      Ban[j][i] = math.cos(B[j])
    elif i == 1:
      Ban[j][i] = math.sin(B[j])

##Plots and animation
fig = figure()
plt.title('Phase Space')
plt.xlabel('Re')
plt.ylabel('Im')

#Plots complex unit circle
plot1 = plt.plot(r2,im2, color = 'g',alpha = 0.4)

#Animation functions
def animate(i):
     plot(Aan[i, 0], Aan[i, 1], color='blue', marker= 'o')
     plot(Ban[i, 0], Ban[i, 1], color='orange', marker= 'o')

ani = animation.FuncAnimation(fig, animate, interval=101)

show()
