0
$\begingroup$

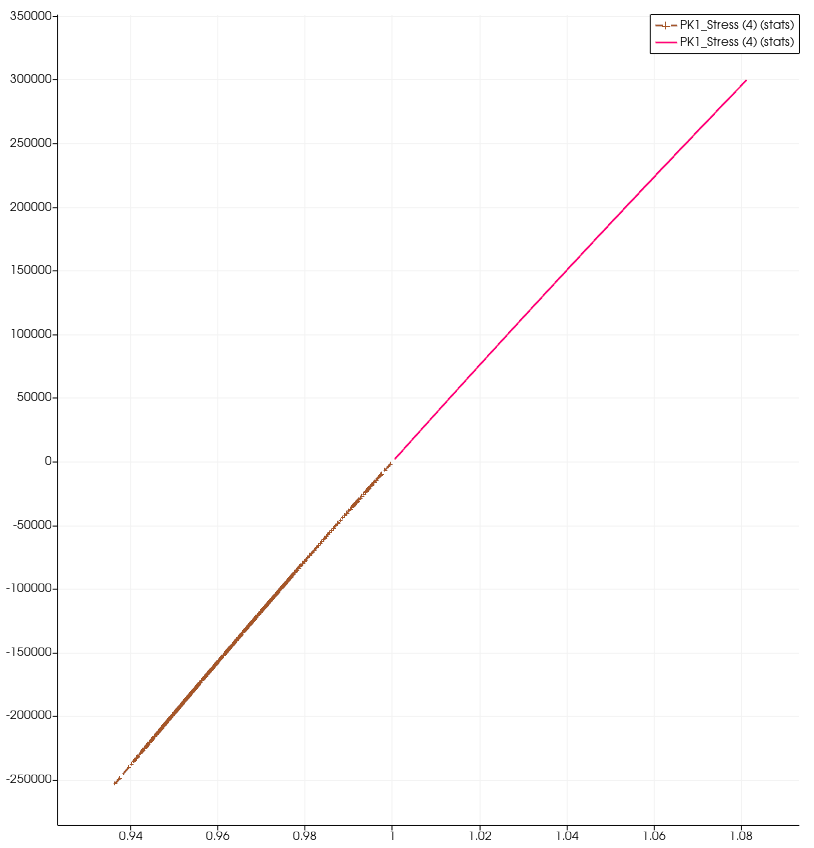
For a FEM simulation of a Neo-Hook solid model, how do we know we are in the "regime" of nonlinearity of the solid? In other words, how do I know the hyperelastic material law is really used, and not just a needless additional computational cost because it can be modeled with a linear elastic Hook law. Following these Wikipedia figures for example, does this mean the nonlinearity really happens when we see a nonlinear relationship between $\lambda_{11}$ and $P_{11}$?

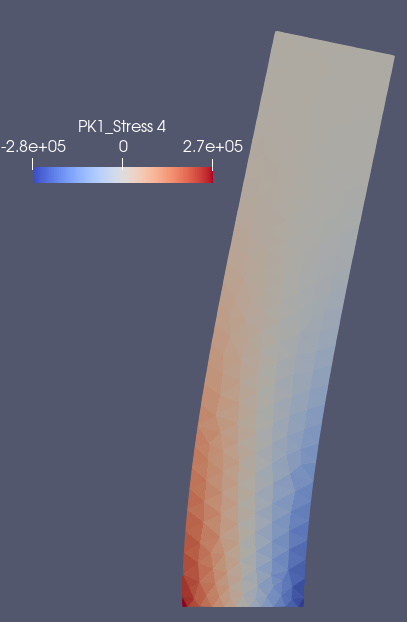
For my case/simulation, I chose the element with the biggest stress values, and I calculated the Lagrange Green strain tensor $\pmb{E}$ there, I computed the eigendecomposition to get the biggest eigenvalue $E_{11}$ and its associated eigenvector $\pmb{v}_{11}$. I then compute the stretch as : $\lambda_{11} = \sqrt{1+2E_{11}}$. For the principal stress I compute : $P_{11} = \pmb{v}_{11} \cdot (\pmb{P}\pmb{v}_{11})$ where $\pmb{P}$ is the first Piola-Kirchoff stress. Should I expect to see a nonlinear relationship here? Is my definition of these quantities correct? In my case, I get something linear: enter image description here
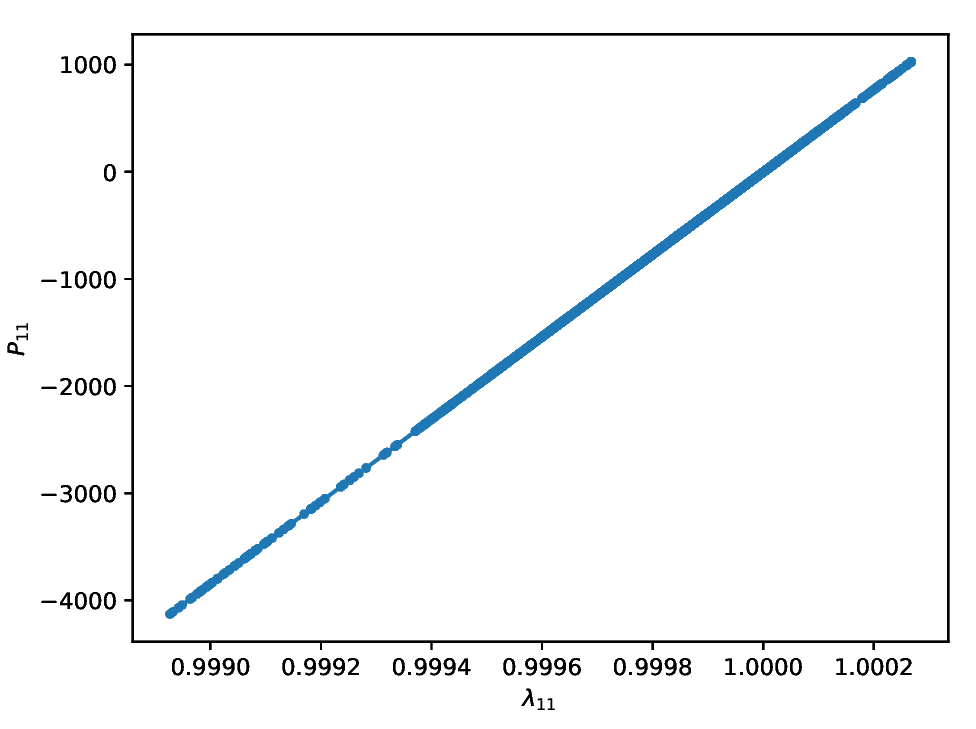
I used $W(\pmb{F}) = \frac{\mu_s}{2}\, (|\pmb{F}|^2 - 3 - 2\, \log(J)) $ with $\mu = 1923076$.
New contributor
Zed is a new contributor to this site. Take care in asking for clarification, commenting, and answering. Check out our Code of Conduct.
$\endgroup$
3
  • $\begingroup$ It looks like you’re still in the linear region, just to understand better, how are you running this model? Also maybe plotting stress $(\mathbf{\frac{\partial W}{\partial E}})$ and strain $(\mathbf{E})$ components directly might help in seeing where the nonlinearity is really present in the material model. $\endgroup$ May 25 at 20:42
  • $\begingroup$ Your $\lambda_{11}$ is close to one. Which means it is close to linear elastic and hence you are seeing a linear response. Make $\lambda_{11}$ much bigger - say 1.2, or 2 or 5 or 10. Then see what you get. Also, you might try plotting the stress-strain curve without using FEM. Try deriving a (non-linear) equation for the stress-strain curve and solve it using fsolve or something equivalent. $\endgroup$
    – NNN
    May 26 at 12:31
  • $\begingroup$ @NNN, would you expand your comment into an answer? $\endgroup$
    – nicoguaro
    2 days ago

1 Answer 1

2
$\begingroup$

Since your $\lambda_{11}$ is close to unity, it means that your response will be close to linear, because your strain is small. You have not provided enough strain for the non-linearity to kick-in.

I would plot over a larger range of $\lambda_{11}$, say from 1 to 5. That should be enough to see the non-linearity.

Also, before doing FEM, I would derive a non-linear relationship between $\lambda_{11}$ and $P_{11}$, solve the resulting equations with some non-linear solver and plot the results. And then compare with FEM.

Edit: Also try plotting an exponential constitutive relation such as the Veronda Westmann model.

$\endgroup$

Your Answer

Zed is a new contributor. Be nice, and check out our Code of Conduct.

By clicking “Post Your Answer”, you agree to our terms of service and acknowledge that you have read and understand our privacy policy and code of conduct.

Not the answer you're looking for? Browse other questions tagged or ask your own question.