5
$\begingroup$

I am looking for help in understanding the use of discrete Fourier transform as an approximation to continuous Fourier transforms.

As an exercise, I considered a Gaussian $$f(x) = \exp\left(-2x^2\right),$$ the (continuous) Fourier transform of which is $$F(k)=\frac{1}{2}\exp\left(\frac{-k^2}{8}\right).$$ I sampled the Gaussian at 10,000 discrete points equally spaced between 0 and 100 and took the discrete Fourier transform of the resulting set of numbers. The question I wanted to ask was how well the discrete Fourier transform compare with the continuous one. Results of this calculation are shown in this figure (thick curve is the analytical, continuous, result; thin one is the numerical, discrete, result):
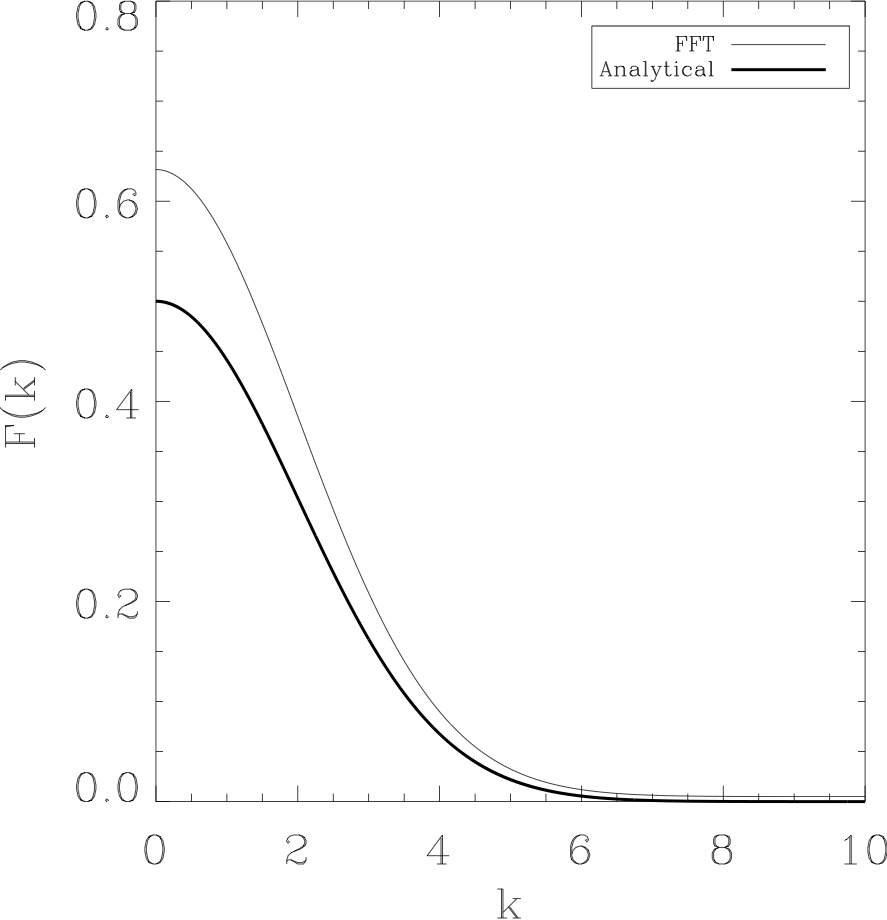
Comparison of discrete and continuous Fourier transforms of a Gaussian.

Evidently, the discrete and Fourier transform are quite different from each other, especially at small $k$. Could somebody help understand why?

Thanks!

Update: It was pointed out that I wasn’t really comparing apples to apples in the plots above. I had assumed different scalings the continuous and discrete cases. I corrected that, but the problem won’t go away. Here is the updated version of the Gaussian calculation above:
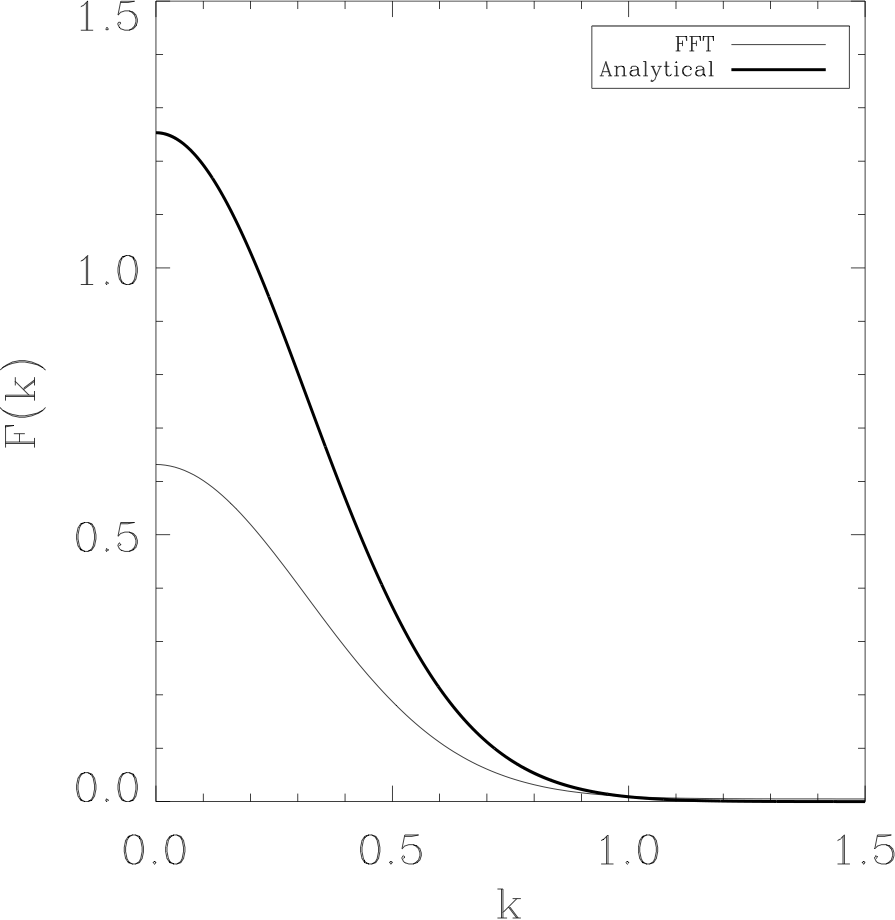
Better comparison of discrete and continuous Fourier transforms of a Gaussian.

To check this on a bandwidth-limited function, I also tried working with the sinc function: $$f(x) = \frac{\sin(x)}{x}.$$ And I have the same problem:
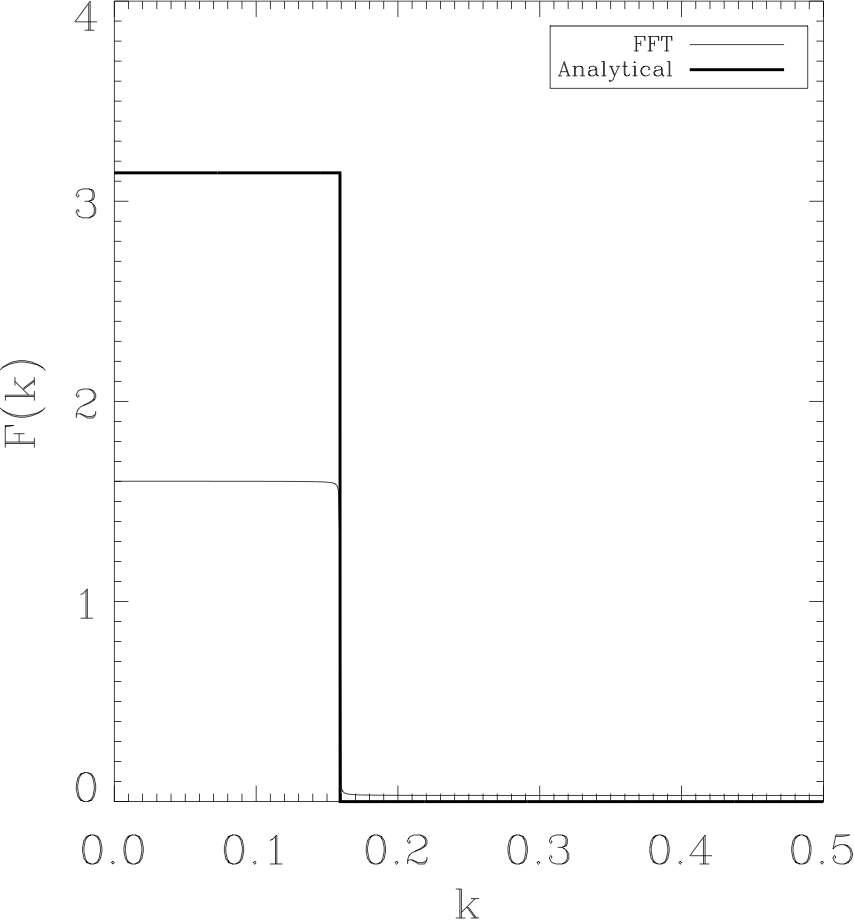
Comparison of discrete and continuous Fourier transforms of the sinc function.

I seem to be getting the exact same factor of difference in both cases, which suggests that I have missed some scaling factor. But I just cannot find one!

Thanks!

$\endgroup$
0

1 Answer 1

3
$\begingroup$

I haven't done the algebra, but I think you have the formula wrong. http://mathworld.wolfram.com/FourierTransformGaussian.html. There's some factors of $\pi$ missing from your answer. Which scaling of the Fourier Transform did you use?

$\endgroup$
4
  • $\begingroup$ Thanks for catching that! I did indeed assume different scaling conventions for the continuous and discrete cases. But the problem does not go away when I correct that. See my updated results above. $\endgroup$ Commented Sep 24, 2013 at 8:30
  • $\begingroup$ @Girish Kulkami: In your updated plots, you're off by a factor of 2. You must have originally been missing a factor of $2/\pi$ or something like that. $\endgroup$
    – Victor Liu
    Commented Sep 24, 2013 at 8:47
  • $\begingroup$ I should add that the zero-frequency value of the Fourier transform is just the "average" value of your function. So you should be able to figure out the correct scaling based on looking at just that value, and making it match the analytical result. Clearly the shapes of your functions are identical, so everything is working correctly except for the scaling. $\endgroup$
    – Victor Liu
    Commented Sep 24, 2013 at 8:50
  • 2
    $\begingroup$ OK Got it. I was not adding up the positive and negative frequency modes in the discrete. The results then match up perfectly. (This still feels non-intuitive. But I guess I just have think it over.) Thanks @VictorLiu. $\endgroup$ Commented Sep 24, 2013 at 9:31

Your Answer

By clicking “Post Your Answer”, you agree to our terms of service and acknowledge you have read our privacy policy.

Not the answer you're looking for? Browse other questions tagged or ask your own question.